

Reference calculator
ACWR Calculator
Your Acute:Chronic Workload Ratio compares your training load this week against a 28-day baseline. Tim Gabbett popularized the rolling ratio in 2016, and Kinoku presents it as a load-spike flag rather than an injury prediction, diagnosis, or safe-training guarantee.
The formula
Acute load (A)   = mean of the last 7 days of load
Chronic load (C) = mean of the last 28 days of load
ACWR = A / C
Historical reference bands (Gabbett 2016)
| ACWR | Zone | Interpretation |
|---|---|---|
| < 0.8 | Below baseline | Recent load is well below the 28-day average |
| 0.8 – 1.3 | Near baseline | Recent load is broadly similar to the 28-day average |
| 1.3 – 1.5 | Moderate spike | Recent load has increased, so the underlying sessions and their context are worth a look |
| > 1.5 | Large spike | Recent load is much higher than the 28-day average |
How to read it
ACWR has been both useful and argued over. Early observational studies reported associations between high ratios and injuries in specific sports. Later methodological reviews challenged the ratio's construction, thresholds, and causal interpretation.
Some say the plain rolling average can overstate the link, and that an EWMA version tracks risk better. EWMA means an exponentially weighted moving average, which leans on recent days more than old ones.
Most coaches treat ACWR as a flag, not a rule. If your ratio jumps from 1.0 to 1.8 in a week, that is worth a look, not because you will get hurt, but because the speed of the change is the signal you can plan around.
ACWR vs Banister TSB
TSB (from the Banister Form Band model) and ACWR are cousins, but they answer different questions. TSB is fitness minus fatigue, so it reads as how fresh you are, while ACWR is acute load ÷ chronic load, so it flags how sharply recent load changed.
You can be fresh and still show a high ratio at the same time, which is the race week where you cut volume but did one hard session, so both lines belong in the call.
Common questions
What is a good ACWR (acute to chronic workload ratio)?
No single good ACWR fits everyone, though Gabbett's work used 0.8 to 1.3 as a reference band and treated above 1.5 as a large jump. Those cutoffs have taken substantial methodological criticism since, so read the ratio as a load-change flag rather than a verdict.
Is the ACWR sweet spot real?
The broad idea has held up: a big steady base handles hard weeks better than a thin one, and sudden spikes are the risky part. The exact 0.8 to 1.3 cutoffs are shakier. The windows are arbitrary, and acute load sits inside chronic load, which inflates the apparent effect.
Can I use weekly mileage for ACWR?
It will compute, but it answers a weaker question. Distance says nothing about intensity, so ten easy kilometres and ten at threshold look identical to it. A load that folds in effort carries what distance drops: session rate of perceived exertion (RPE) times minutes, TRIMP (heart-rate strain), TSS (training stress against your own threshold), or tonnage.
What is the difference between ACWR and TSB (training stress balance)?
ACWR is acute load divided by chronic load, so it reads as how fast your training changed. TSB is fitness minus fatigue, so it reads as how fresh you are. You can be fresh and still show a high ratio, which is exactly what race week looks like.
Privacy
This calculator runs in your browser, so the load values you paste in are never sent anywhere, and nothing is saved between visits. It makes no network requests at all, which leaves nothing to intercept and nothing to log.
Full story
The ACWR explainer in the Learn section covers where the sweet spot came from, why researchers pushed back on it, and how it differs from the Form curve. For the head-to-head, ACWR vs the fitness-fatigue model looks at which of the two warns first.
Track this in Kinoku
The Pro Analytics Recovery tab tracks ACWR for you, computed from your lifting tonnage over the same 7-day and 28-day windows. Runs feed a separate training-stress ratio that sits behind the Kinoku Score rather than this gauge. Pro Analytics is a paid feature, and the calculation runs locally, so no Kinoku server stores your training history, while eligible Android backup may copy main-app data to your Google account.
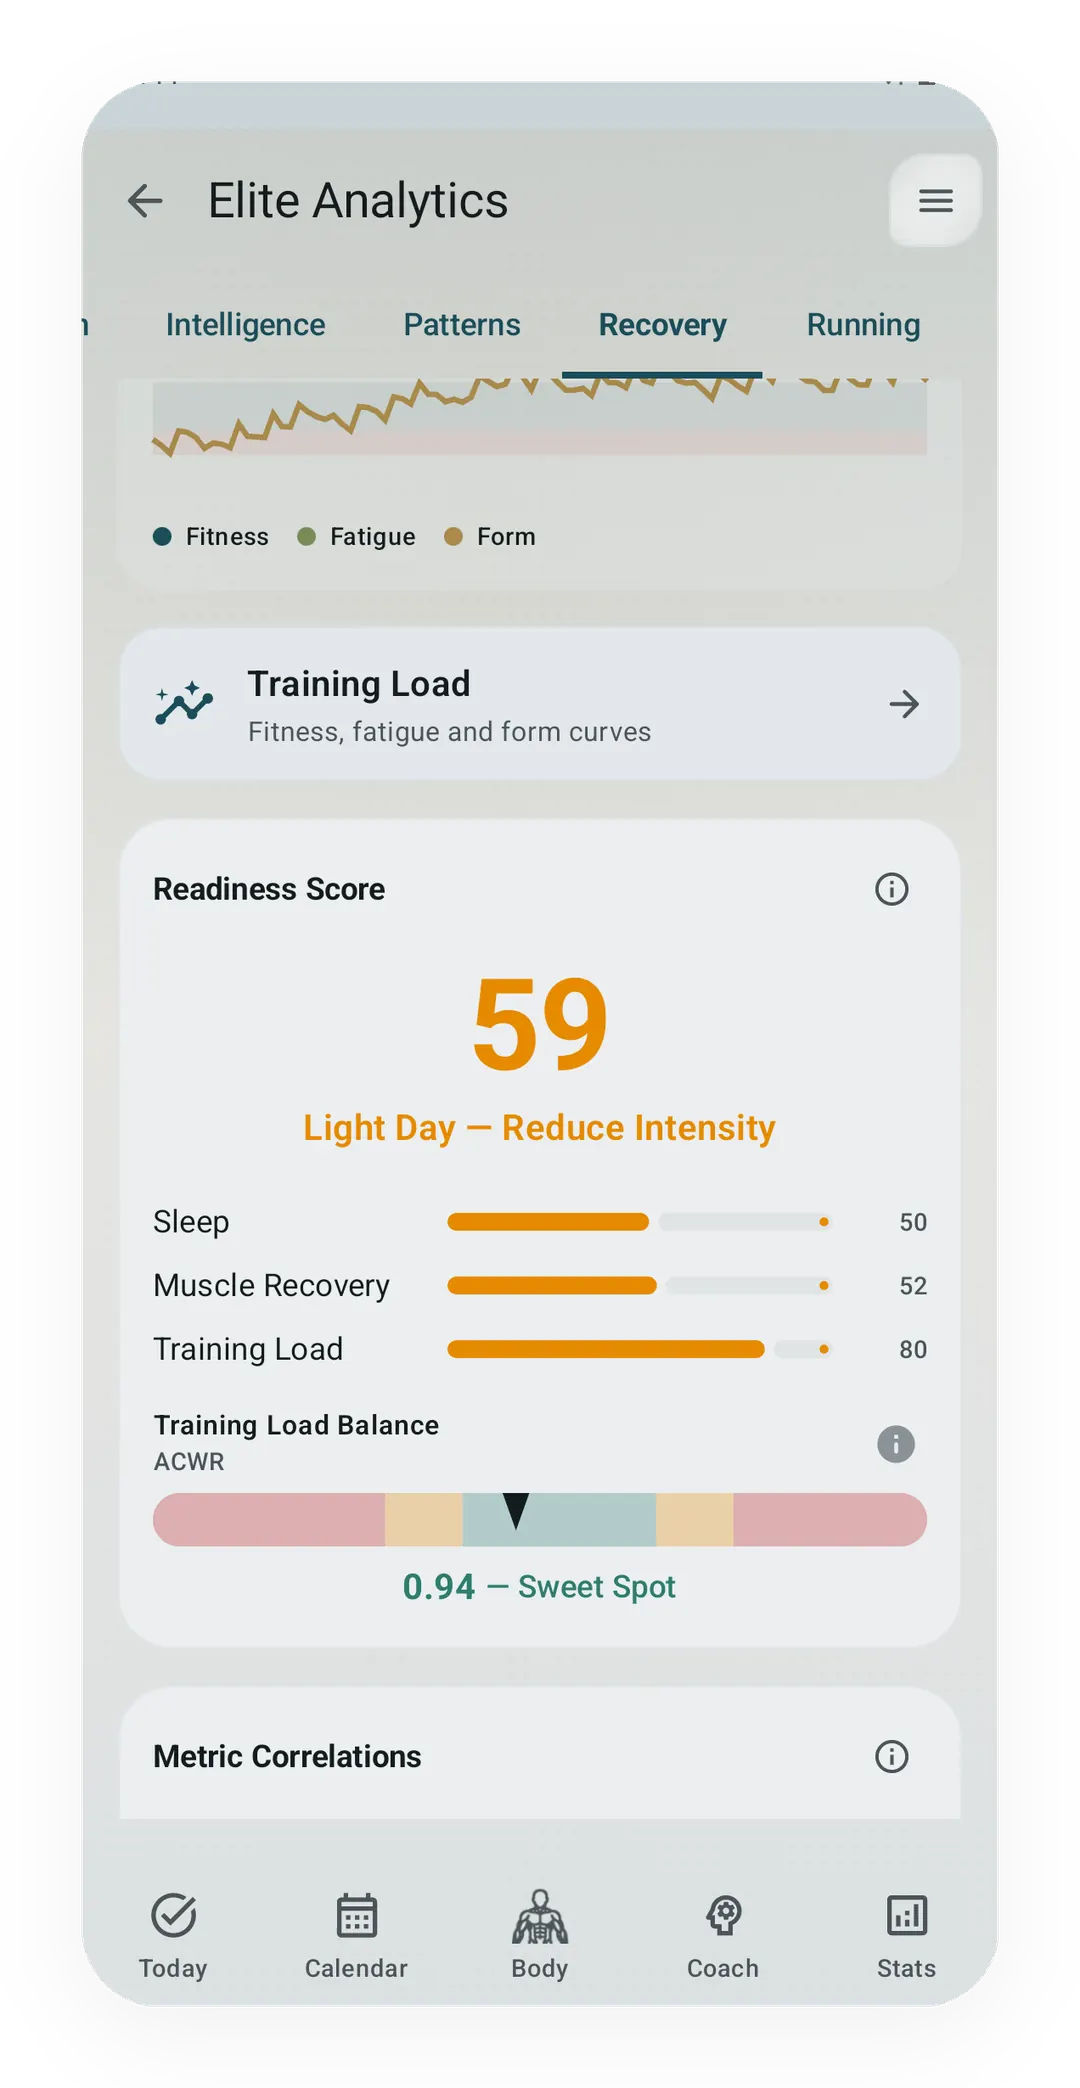
Pro Analytics → Recovery tab
Pasting 28 days of load is the hard part of this calculator. The app already has those 28 days, so the ratio is just there.
ProPart of Pro. The free tier still records the training it reads from.
Track this in the app
Pro Analytics
A Pro hub with five core tabs, plus a Cycle tab when cycle tracking is on. Its 20+ features include strength scores like DOTS, IPF GL, Wilks, and FFMI, the Banister Form Band, plateau alerts, ACWR, muscle balance, and cycle links.