Elite Analytics
A 6-tab hub with 20+ features: DOTS, IPF GL, Wilks, FFMI, the Banister Form Band, plateau alerts, ACWR, muscle balance, and cycle links.
Proof surface
What this feature looks like in the app
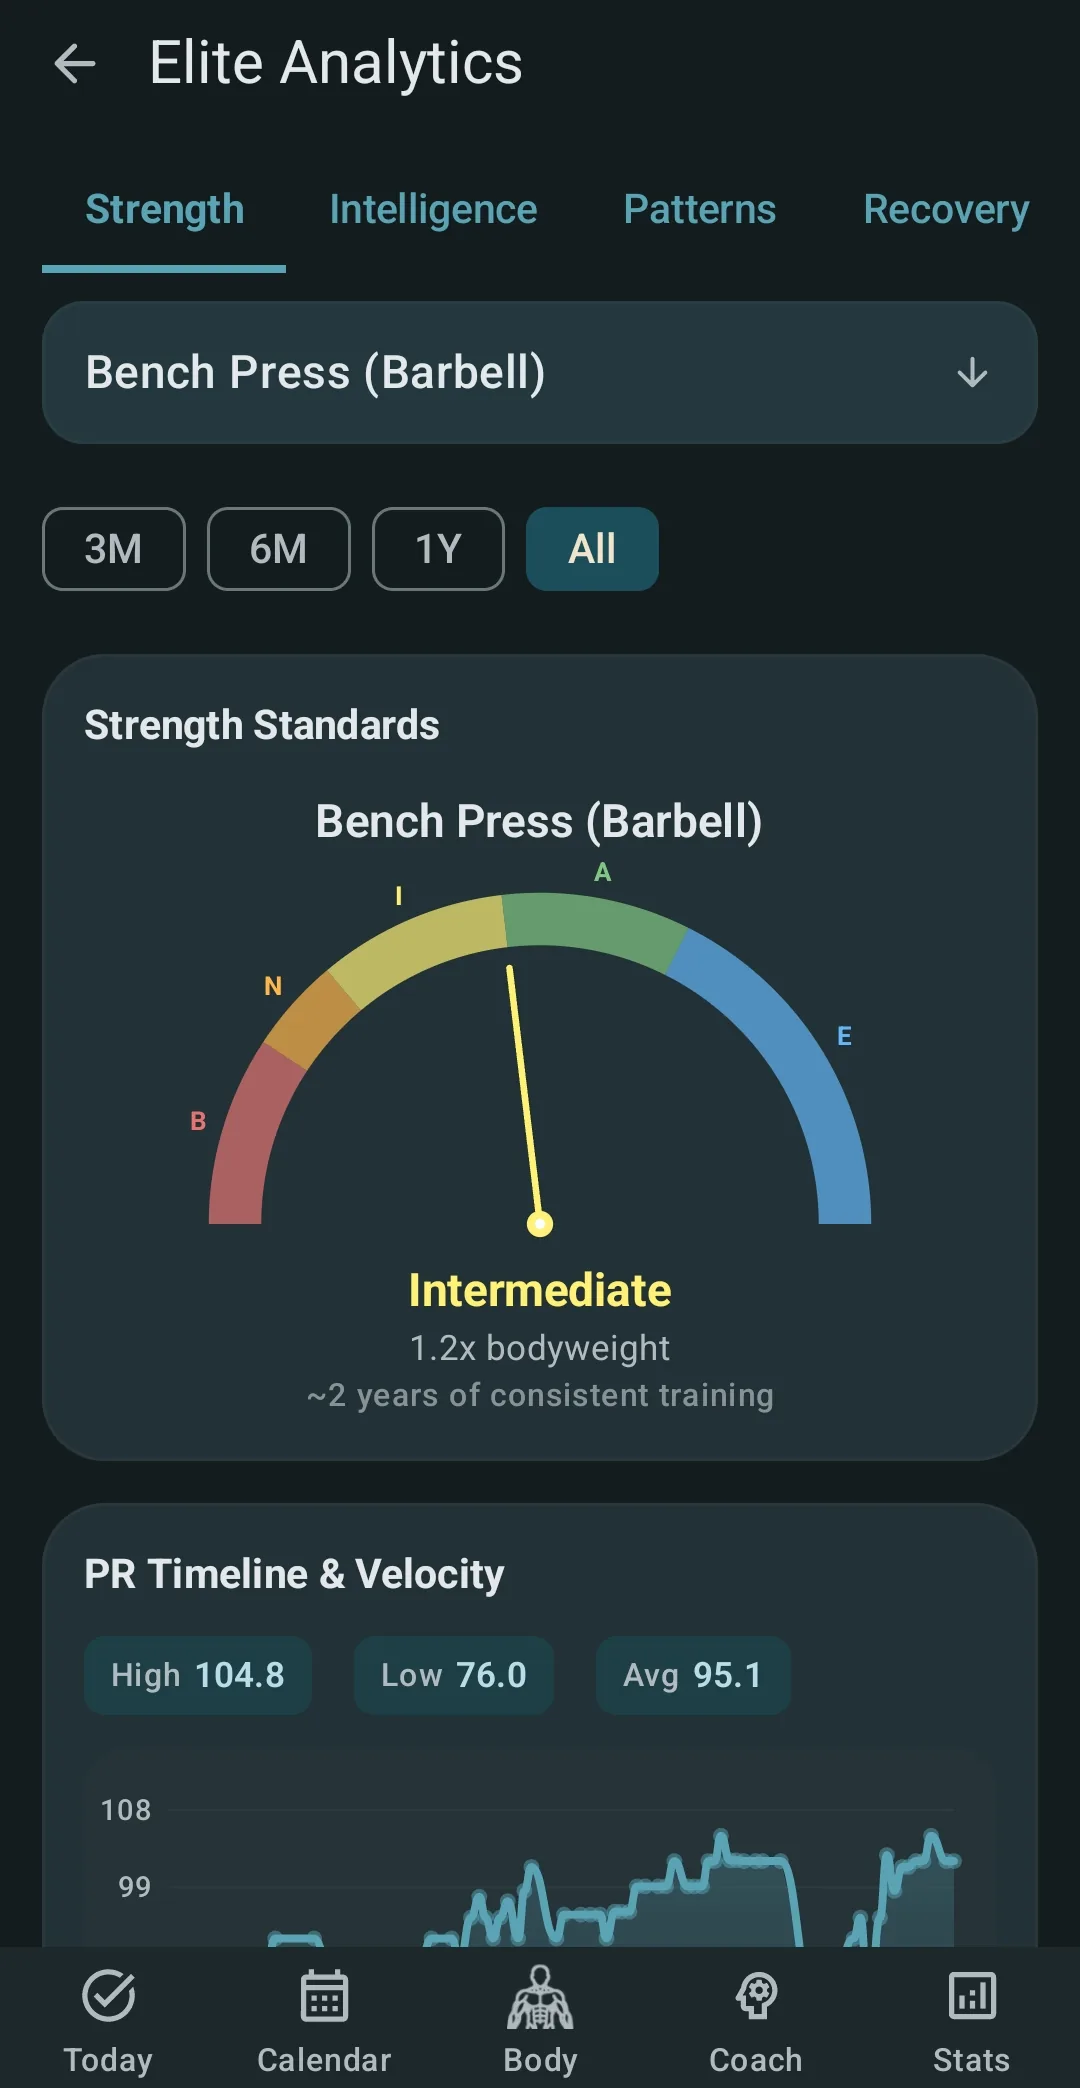
Where your lifts stand
Real capture. Strength scores rank each lift from beginner to elite, with your PR trend below.
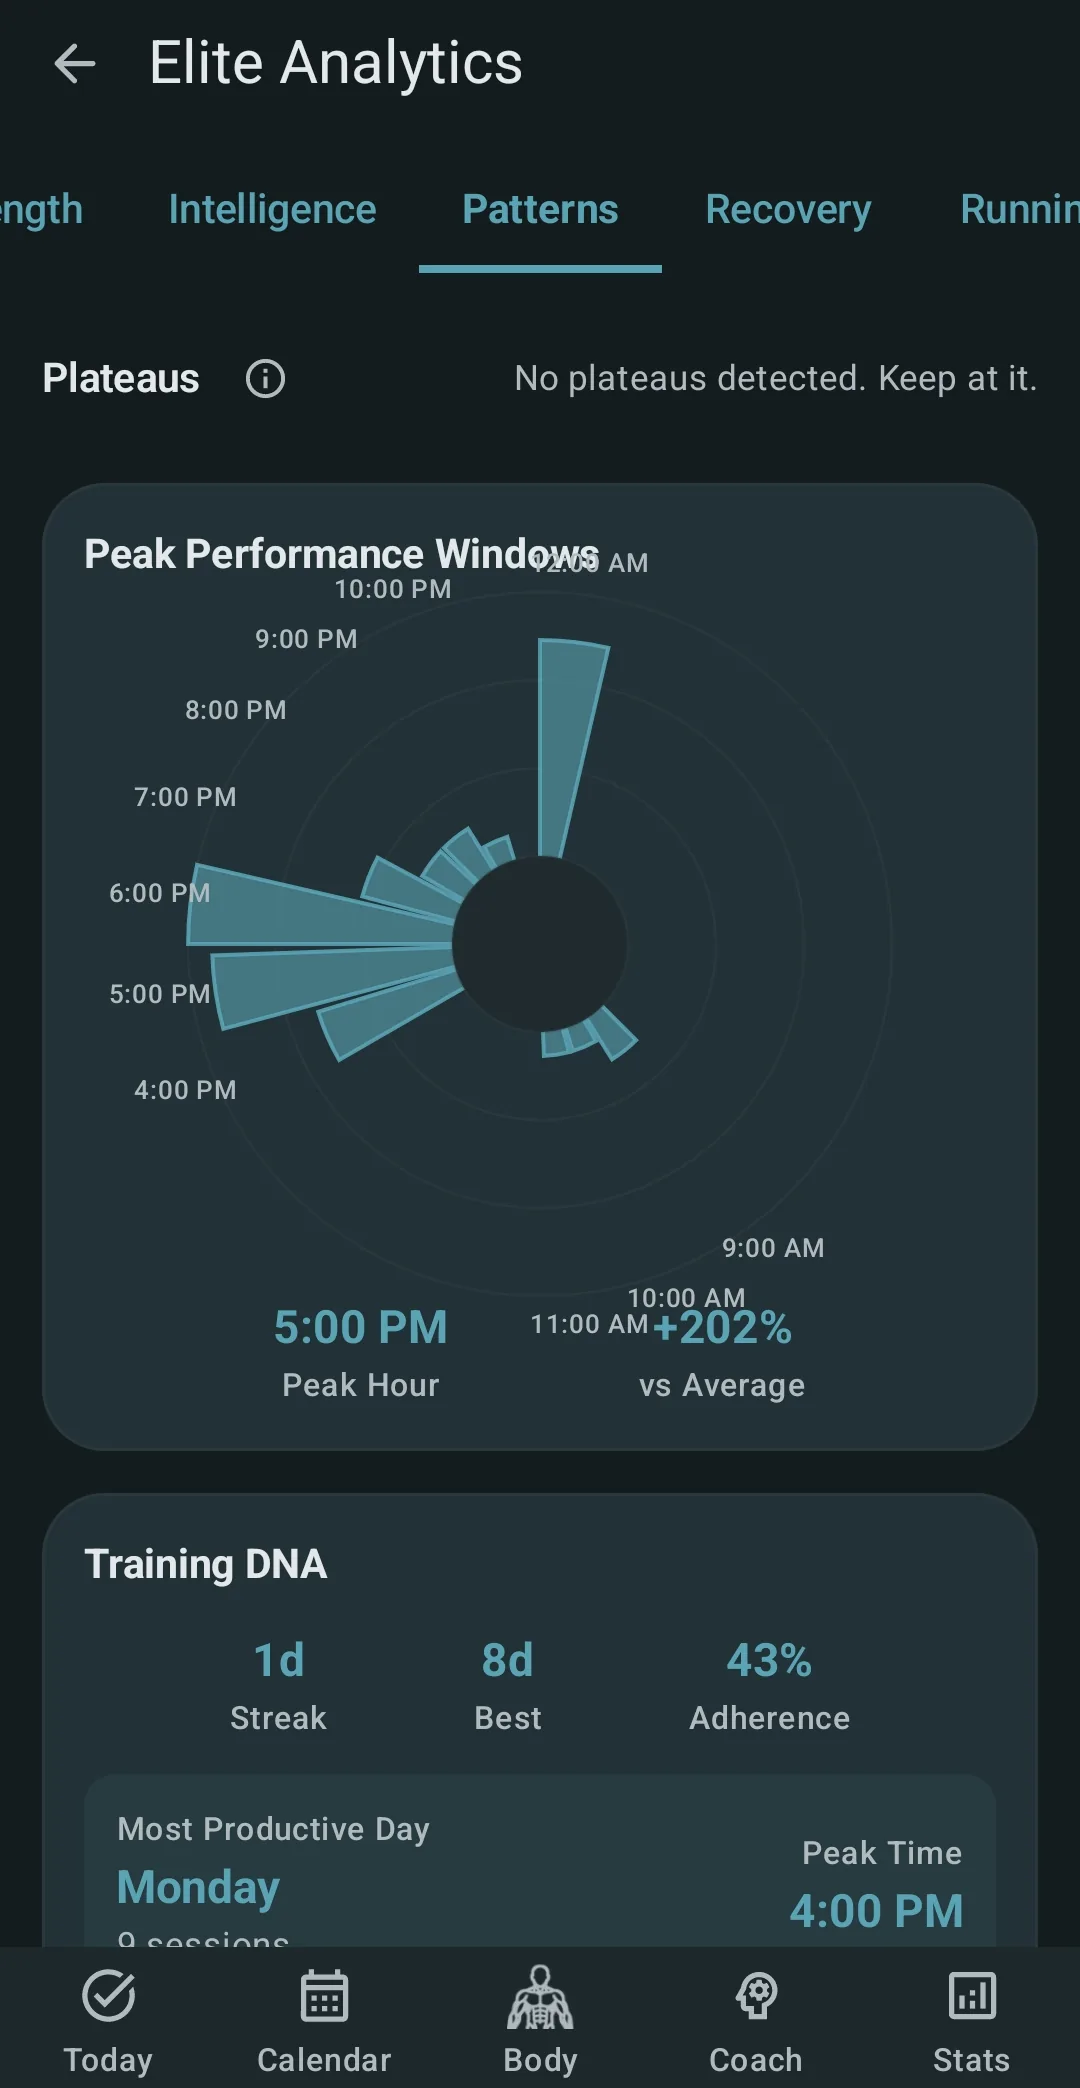
When you train best
Real capture. Your best hours and days, pulled from months of sessions.
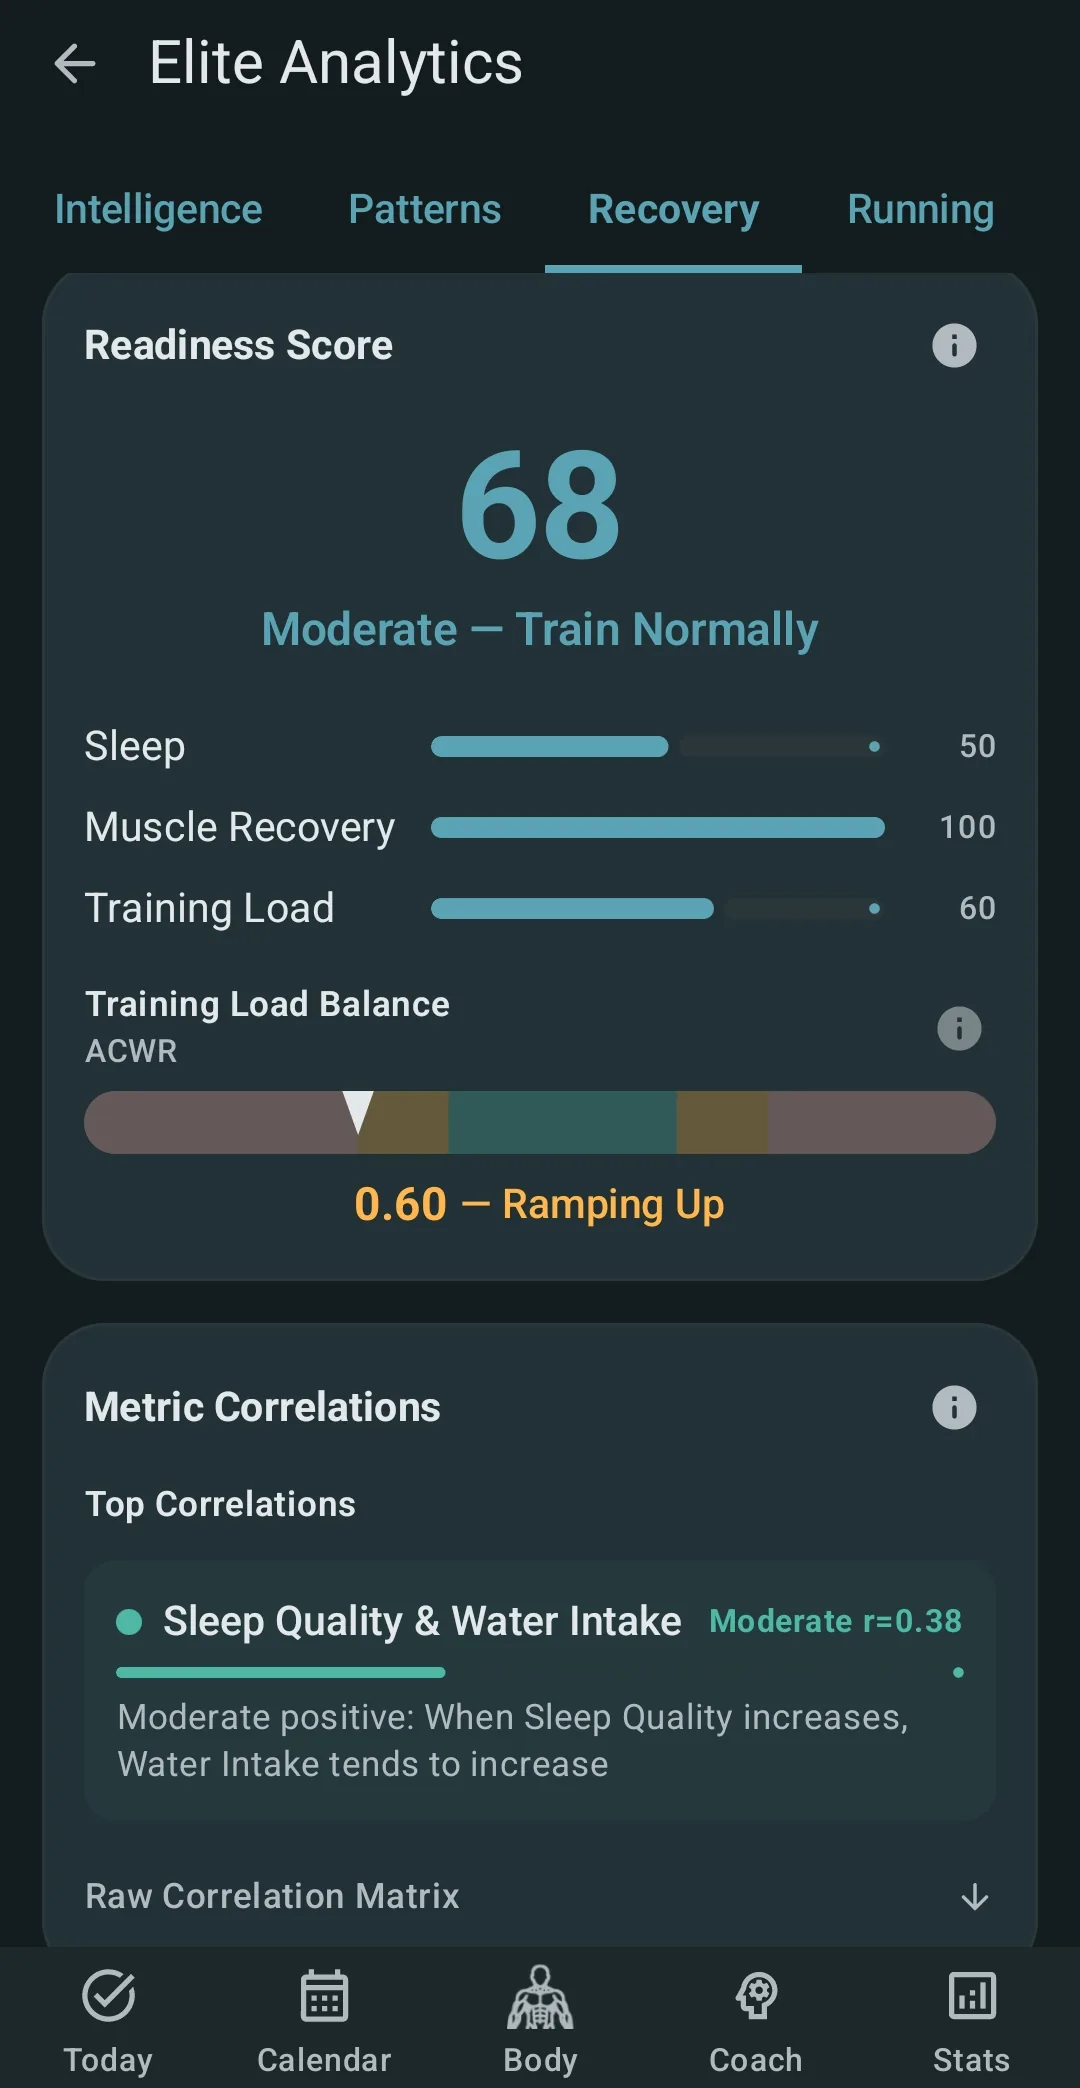
Ready to train, or not
Real capture. A readiness read from sleep, muscle recovery, and training load.
What it is
This is a screen for athletes who want to read their training the way a sport scientist would. It has six tabs and over 20 tools. Every number is worked out on your phone, from the data you already logged. You do not type anything extra, and nothing leaves your device. No spreadsheets either.
Every number can be traced. Tap the Why? panel on any card and Kinoku shows you the inputs, the math, and how sure it is. You can agree or not. The app is here to show you patterns. You still make the call.
Tab 1: Strength
Your lifts, your progress, and the scores that compare you to other lifters.
- Strength Standards. These compare your total to four lifting scores. Three of them, DOTS, IPF GoodLift, and Wilks 2, rank lifters fairly across body weights. The fourth, FFMI, looks at how much muscle you carry for your height. The score tables ship inside the app. There is no network call and no account.
- PR timeline and bar speed. See your personal records over time. For loaded lifts, you also see how fast the bar moved.
- Strength trend. Kinoku draws a line through your last 12 weeks of estimated one-rep max per lift. It adds a range to show how sure it is, plus a guess at how many days until your next goal.
- Lift ratios. Compare squat to bench, bench to deadlift, press to bench, hamstring to quad, and push to pull. Target ranges show you when one side is falling behind.
- RPE drift. When your top sets start feeling harder at the same weight, Kinoku spots it. It shows up as an alert on the Coach screen.
- Form Band. This curve tracks your fitness and your fatigue. As fitness goes up and fatigue comes down, your form rises. It runs over gym, run, and brisk-step load across 90 days. Apps like TrainingPeaks made this idea well known.
Tab 2: Intelligence
Patterns across your whole training history.
- Muscle balance radar. A spider chart of your weekly volume per muscle group, set next to balanced ratios. Run days count too. You spot a weak side at a glance.
- Frequency tuner. Kinoku looks at how often you train each muscle and how it grows. Then it shows the hit rate where you make the most progress.
- Frequency overlay. Lift days, run days, and brisk-step days on one calendar. You see what your real week looks like.
- Exercise efficiency. Which moves give you the most progress per unit of work.
- Volume landmarks. For each muscle, Kinoku tracks three weekly set counts. The least that helps. The most you can grow from. The most you can recover from. It adjusts these as you train.
- Effective volume. What share of your sets land in the rep range that fits your goal.
Tab 3: Patterns
Things you cannot see from one workout.
- Best windows. Which time of day, day of week, and part of your training cycle you tend to lift best. You can plan hard days around it.
- Consistency heatmap. A calendar of how closely you hit your planned sessions, with a week-by-week trend.
- Session makeup. What your average session really looks like, split by exercise type and set type.
- Plateau alerts. When a lift has been flat for three cycles, Kinoku flags it. It then suggests moves that hit the same muscles a different way.
Tab 4: Recovery
Your recovery dashboard.
- Readiness score. A 0 to 100 score that blends sleep, heart-rate variability, muscle recovery, and your training load. It can feed the optional layer that pre-adjusts tomorrow’s weights and reps.
- Training Load. Daily readings for fitness, fatigue, and form, from the same fitness-and-fatigue model. Your own notes and any readiness changes show up next to them.
- Fatigue and output curve. How your piled-up load lines up with what you can do, with warnings when you push too far.
- Workload ratio (ACWR). This compares your last week of load to your last month. A ratio of 0.8 to 1.3 is the safe zone. Above 1.5 is the risk zone. Sport medicine uses it to flag spikes in load.
Tab 5: Running
Run analytics in the same hub.
- Race Predictions. Kinoku blends two trusted models, VDOT and Riegel. It predicts your 5K, 10K, half, and full marathon times. The range widens when the two models do not agree.
- Pace progress. Your rolling pace trend over the last 8 to 26 weeks, split by run type: easy, tempo, threshold, and race.
- Split breakdown. Every run cut into kilometer or mile splits, with a score for how steady your pace was.
- Elevation. Climb per run, an effort bump for the hills, and a way to compare hilly and flat routes fairly.
- Run PR timeline. Your best 1K, 5K, 10K, half, and full efforts. Old records still show, but a fresh one stands out.
Tab 6: Cycle
Cycle-phase analytics, open to anyone who has logged three or more full cycles.
- Phase patterns. How your volume, RPE, and PR rate compare across the four cycle phases, using your own data. No one-size advice.
- Per-exercise sensitivity. Which of your moves show a real pattern across phases, and which do not. It is honest when the data is thin and never oversells.
- Symptom overlay. Lay your energy, mood, and cramps over your training output. You see the link instead of guessing at it.
Readiness and automation
Beyond the six tabs, Elite turns on three tools that run on the same engine.
- Autoregulation. After each workout, Kinoku adjusts next session’s weights and reps. It uses your reps in reserve and your fatigue. Feel strong, and it pushes. Feel spent, and it backs off.
- Weight suggestions. Kinoku suggests a load for your next set. It reads your last 8 sessions, your program, and your readiness.
- Auto rest days. When your readiness is low, Kinoku can suggest a rest day. It carries that day across your streaks, Pulse, achievements, and Coach, so a real rest day never breaks your record.
How the numbers are computed
Every engine here is written up. The methodology page walks through the exact math: the fitness-and-fatigue averages, the lifting score formulas, the workload ratio, the volume landmarks, and how the Kinoku Score is split and shared out.
Articles in /learn cover the why. Why the fitness-and-fatigue model works, how DOTS replaced Wilks, what relative strength means for body-weight moves, and what cycle-phase research backs.
Who this is for
Most lifters do not need this. If you hit PRs every few weeks on a simple plan, the free stats and muscle map already give you plenty.
Elite Analytics fits people who have trained hard for two or more years and hit a real plateau. It helps you tell apart too much load, too little volume, and a move that is just not working. It also fits coaches, physios, and competitive athletes. They get the same engines the big training apps use, in a private offline app.
If this page got you excited, you likely already know if you want it.
Part of Elite
This is one of the optional extras, on the deepest tier. The free app works without it.
Try it for yourself.
Available on Google Play. This surface expands in the Elite tier.
Get on Google PlayRelated surfaces
A 4-phase planning stack with 13 templates, progression, readiness, and tiered smarts.
Coaching screens that run on your phone and explain what changed in your training and why it matters.
Offline run analysis with splits, a fitness score from your runs, a pacing score, best efforts, race forecasts, and a compare card that stacks each run against your similar past runs.
A fitness-and-fatigue model that runs across your gym, run, and brisk-step load. The same curve TrainingPeaks made famous, on your phone.
DOTS, IPF GoodLift, Wilks 2, and FFMI with offline percentile tables. The numbers real lifters use.