Run Studio
A deep look at one run. Pace, heart rate, and elevation on linked charts you can pinch to zoom. Tap the route to jump to that moment, and read marks for your peaks, fastest splits, and fatigue points. The whole screen is free. Pro adds replay. Elite adds ghost-compare against another run, your own notes, and video export.
Proof surface
What this feature looks like in the app
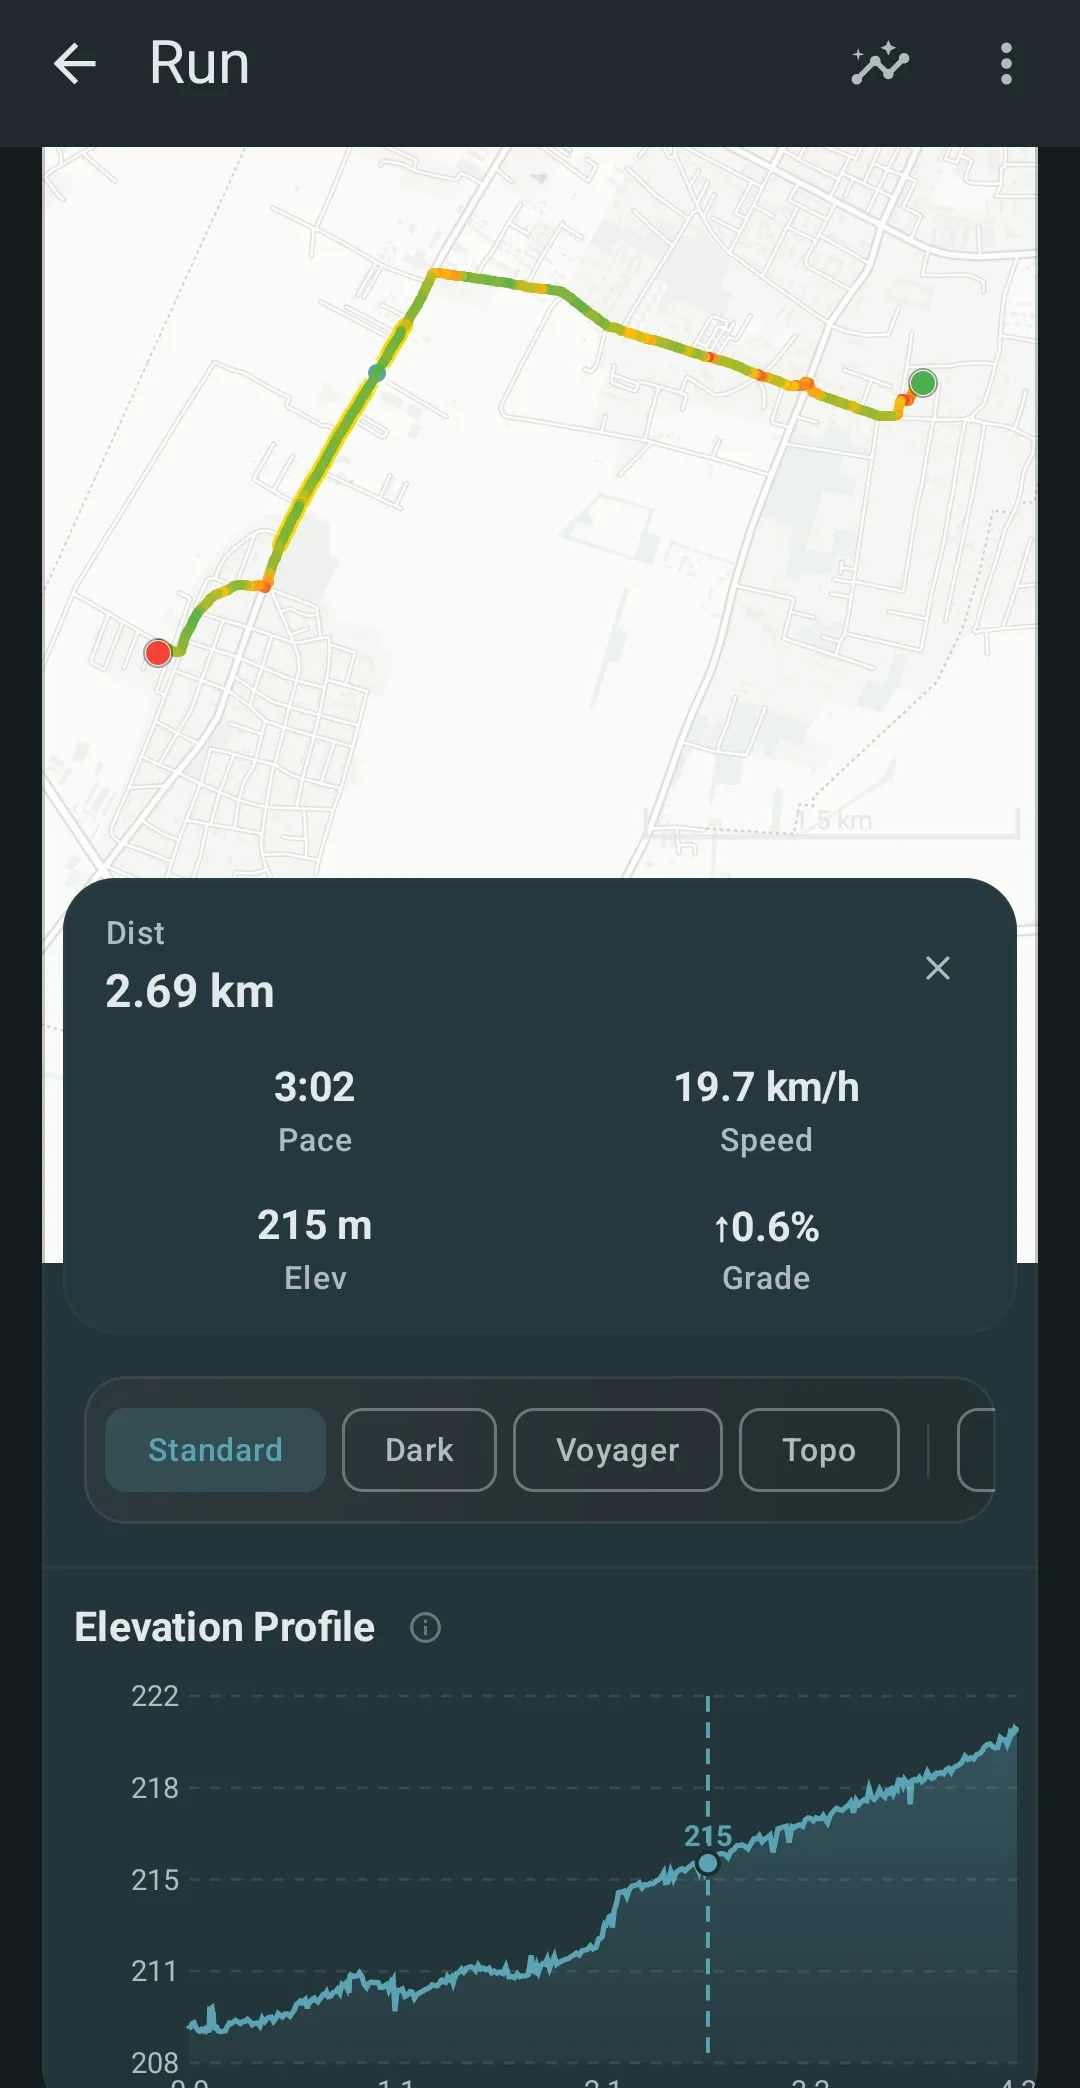
Tap any point on the run
Real capture. Tap the route to read your pace, speed, and elevation at that spot.
Tier shape
How access changes by tier
Every chart, every card, and the marks come free.
Watch the run play back across every chart at quarter to eight times speed.
Compare two runs, pin your own notes, and export a video clip.
What it is
Run Studio reads one run the way a coach would. It stacks charts on top of each other: pace, heart rate, and elevation. They all share one zoom and one moving cursor. Pinch one chart and they all zoom together. Drag your finger and a marker shows where you were on the map. Press and hold to pick a slice of the run. The stats for that slice show up on top: average pace, average heart rate, elevation gain, distance, and time.
Tap a spot on the route line and the cursor jumps to that exact moment. This works even when your route crosses itself, like an out-and-back or a loop. Simpler apps often land on the wrong pass.
The nine charts
Below the main charts sit nine cards. Each one shows a different thing:
- Peak pace curve. Your fastest steady pace for every length, from one second up to the full run. It’s the most useful chart for racers. You can read your race shape right off it.
- Pace vs. heart rate. A dot for each moment, colored by time. If the dots drift one way as the run goes on, your body is working harder for the same speed. That’s a sign of fatigue.
- Lap grid. One box per 100 meters, colored by how far off your average pace it was. Cool colors held the pace. Warm colors drifted off. One look shows where you ran the plan and where you slowed.
- Hill chart. Your climbs, colored by how steep they were. Steep parts glow as a warning. No more guessing which hill that was.
- Form ring. A round chart of how steady your steps stayed. A tight ring means steady form. A wide one means fatigue changed your stride.
- Fade chart. Your heart-rate-to-pace ratio over time, with a band from your first quarter. Drift past it means your easy pace got hard.
- Wind compass. Your average pace in each direction. It shows where a headwind slowed you on a loop.
- Pace lane. A target band around your average pace. See how often you held it and how often you drifted off.
- Wind chart. The head- or tail-wind over time. It needs the Open-Meteo weather opt-in.
Marks worth noticing
Kinoku scans each run when you open it and pins marks on the charts. It flags your peak heart rate, your fastest 1 km, 5 km, and 10 km, big pace jumps, the point where fatigue set in, hills you held for 30 seconds or more, fast recoveries where your heart rate dropped a lot, drops in step rate, and long head- or tail-wind sections.
ELITE users can add their own notes at the cursor. You pick the text and color. They save and show up next to Kinoku’s marks. Yours render as solid pins, so you can tell them apart.
Comparing two runs (ELITE)
Tap Compare and pick another run. Its line shows up as a faint ghost on every chart. Its route shows up as a second line on the map. The chart edges grow to fit both runs, so neither gets cut off.
A card at the top sums up the two runs in plain words. It shows pace, heart rate, and climb for both, side by side. It also gives you the gist in one line, like “This run was quicker, mostly in the back half.” So you read the result, not every squiggle.
The pick list sorts itself for you. Runs on the same route come first. Then runs of a close distance. Then your recent runs. The run you want is usually right at the top.
You can line the two runs up two ways. By time puts the same moment side by side. By distance lines up the same spot on the course. So a hill at the 2 km mark sits in the same place on both lines. That makes a same-route run easy to read.
Open a run you have done before and Kinoku can offer to compare it with your last run on that route. Tap Compare to see them together, or tap the X to hide the offer.
Replay (PRO+) and video export (ELITE)
Watch the run play back, from a quarter speed up to eight times speed. The cursor slides across every chart. The map marker moves along the route in step. Pinch or drag at any point and the replay pauses, so you can take a close look.
ELITE users tap share as video to make a 1280×720 clip. For now it’s a still frame with the run’s distance, pace, time, and a small route map. Full moving playback is on the roadmap.
Smooth, fast interaction
Pinch one chart and they all zoom. Drag to move around. Press and hold to pick a range. Tap to set the cursor. Scroll up or down on a chart and the page scrolls with it. There’s no jitter when you change moves mid-drag.
Zoom in past the map’s tile limit and Kinoku switches to a tile-free view. It lets you zoom in as far as you like on the route shape. That helps when you want to study a tight turn or a short loop.
Privacy and offline
The whole screen works offline. Nothing goes to the cloud. The route, the charts, the marks, and the video all stay on your phone. The marks are worked out fresh each time you open a run. So they show the latest data. Heart rate from Health Connect can arrive a few minutes after a run ends.
Tier matrix
The whole interactive screen is free. Every chart, every card, and the marks come at FREE. PRO adds replay. ELITE adds the ghost compare, your own notes, and video export.
| Feature | FREE | PRO | ELITE |
|---|---|---|---|
| All chart panes (pace + HR + elevation) | ✓ | ✓ | ✓ |
| Pinch-zoom, range-select, linked crosshair | ✓ | ✓ | ✓ |
| All 9 unique visualizations | ✓ | ✓ | ✓ |
| AI auto-annotations (view) | ✓ | ✓ | ✓ |
| Replay playback | - | ✓ | ✓ |
| Ghost-runner comparison | - | - | ✓ |
| User-pinned annotations | - | - | ✓ |
| MP4 video export | - | - | ✓ |
The free layer
The free core here stands on its own. Pro and Elite are optional extras on top.
Try it for yourself.
Available on Google Play. This surface expands in the Elite tier.
Get on Google PlayRelated surfaces
Offline run analysis with splits, a fitness score from your runs, a pacing score, best efforts, race forecasts, and a compare card that stacks each run against your similar past runs.
Live pace, splits, a route map, audio cues, and weather. It works offline, with no upload and no account.
Pace zones, easy-versus-hard balance, and a training effect score built into your runs.