

Reference calculator
Heat & Dew Point Pace Calculator
Heat slows you down, and the dew point decides how much. You cool off by sweating. When the air already holds a lot of water, your sweat cannot evaporate, so the cooling stops working. Put in the air temperature and the dew point, and this shows the pace range that costs you the same effort.
How much slower should you run in the heat?
For most runners it lands between 2% and 10% slower on a warm day, and more when the dew point is high. Faster runners lose the least. The longer the run, the more the heat adds up. Any single number is a rough band, because heat tolerance varies a lot between people and changes as you get used to it.
The model
This runs in four steps. Each one is shown so you can check it.
1. Water vapour in the air, from the dew point (Td, in °C)
   e = 6.1094 × exp( (17.625 × Td) / (Td + 243.04) )      hPa

2. Estimated wet bulb globe temperature, from air temp (T) and e
   WBGT = 0.567 × T + 0.393 × e + 3.94                    °C

3. How much you slow per °C of WBGT above 15 °C
   0.19 % per °C at a 3:00 / km runner
   0.64 % per °C at a 4:12 / km runner
   straight line between the two, held flat past 5:30 / km

4. The adjustment
   slower % = slope × (WBGT − 15) × run-length factor
   run-length factor: 0.45 under 30 min · 0.65 for 30–60 min
                      0.85 for 1–2 h    · 1.0 over 2 h
   the middle figure is capped at 25 %

   Range shown = that number, give or take half of it,
   so the top of the range can reach 37.5 %.
Where the numbers come from
Step 1 is the Magnus formula with the Alduchov and Eskridge coefficients, which is standard weather maths.
Step 2 is the simplified wet bulb globe temperature (WBGT) used by the American College of Sports Medicine (ACSM), and it needs only temperature and humidity. Leaving out sun and wind makes it read a little high on a cloudy or breezy day and a little low in full sun.
Step 3 comes from Ely and colleagues (2007), who matched years of results from seven North American marathons against the weather on race day. Boston went back 36 years, Richmond only 6. Two things stood out. Performance dropped steadily as WBGT climbed from 5 °C to 25 °C, and slower runners lost far more than fast ones.
| WBGT on race day | Top 3 men | Top 3 women |
|---|---|---|
| 5.1 – 10 °C | 1.7% off the course record | 3.2% |
| 10.1 – 15 °C | 2.5% | 3.2% |
| 15.1 – 20 °C | 3.3% | 3.8% |
| 20.1 – 25 °C | 4.5% | 5.4% |
Those are the leaders. The 300th place finishers in the same races slowed about 3.2% for every 5 °C of WBGT, close to three times the hit the leaders took. Step 3 draws a line between those two findings and reads your own pace off it.
What this model does not cover
- Getting used to the heat. Two weeks of training in hot weather makes a real difference. The maths here does not know whether you have done that, so an acclimatised runner will beat this number and a runner straight off a cool spell may not reach it.
- Sun and wind. Step 2 works in the shade. Open road at midday is harder than this says. A breezy overcast morning is easier.
- Very hot weather. Marathons are rarely held above 25 °C WBGT, so there is little data up there. Past that point the tool is guessing, and it says so on screen.
- Short and fast work. The research is marathon data. The run-length factor in step 4 scales it down for shorter sessions. That factor is our own estimate, not a published finding.
- You. The spread in the original study was about as wide as the average itself. That is why the result is a range.
Reading the conditions
The band next to your result comes from the estimated WBGT. These are the categories the American College of Sports Medicine publishes for endurance events.
| Estimated WBGT | Band | What it usually means |
|---|---|---|
| Up to 18 °C | Mild | Little to no effect on pace for most runners |
| Over 18 to 23 °C | Warm | Pace slips on longer runs. Effort feels higher than the watch says |
| Over 23 to 28 °C | Hot | Clear pace cost. Past 25 °C the marathon data thins out |
| Over 28 °C | Very hot | ACSM's black flag. Well past the research, and some races cancel here |
Another tool worth knowing
If you want a second opinion, the Running Writings heat calculator fits its own model to 3,891 marathon runners across 754 races, and shows its work. It is a good cross-check, and its answers will not always match this one.
Common questions
Does heat slow down slower runners more?
Yes, by a lot. In the Ely 2007 marathon data, the leaders gave up about 0.9% for every 5°C of heat. The 300th place finishers gave up about 3.2%, close to three times as much. They are out on the course longer, so the heat has more time to build up.
Why does dew point matter more than humidity?
Relative humidity moves with the air temperature, so the same reading means different things at 10°C and 30°C. Dew point is a fixed measure of how much water the air holds. It tells you straight away whether your sweat can evaporate, and evaporation is how you shed heat.
What dew point is too hot for running?
Runners tend to notice a change above about 15°C (60°F) dew point. Above 21°C (70°F) most people feel it strongly and pace drops even on easy runs. There is no hard line. Someone who has trained in the heat for a few weeks copes far better than someone who has not.
Does this replace running by feel?
No. Effort is the better guide on a hot day, and this tool is a way to set expectations before you head out. If your heart rate or breathing says the adjusted pace is still too hard, the heat is telling you more than the maths is.
Does Kinoku adjust my pace targets for heat?
No. Kinoku records the weather on each run if you turn that on, so you can see the conditions next to the result later. It does not change your plan or rewrite your pace targets. That call stays yours.
Privacy
This calculator runs in your browser. Your temperature, dew point, and pace are never sent anywhere, and nothing is saved between visits. There is no email box on this page and nothing to sign up for. The calculator makes no network requests at all, so there is nothing to intercept and nothing to log.
Full story
The heat and dew point explainer in the Learn section covers why dew point beats humidity, what heat does to your body while you run, and how getting used to hot weather changes the numbers.
Track this in Kinoku
GPS run tracking in Kinoku is free. Turn on weather context and each run saves the temperature and wind alongside your splits, so a slow run in August still makes sense in December. A second toggle adds air quality, pollen, and the UV (ultraviolet) index. Your spot is rounded to about 1.1 km before the weather request, so your exact location stays private.
Kinoku does not rewrite your pace targets for the weather. It records what the day was like and leaves the call to you.
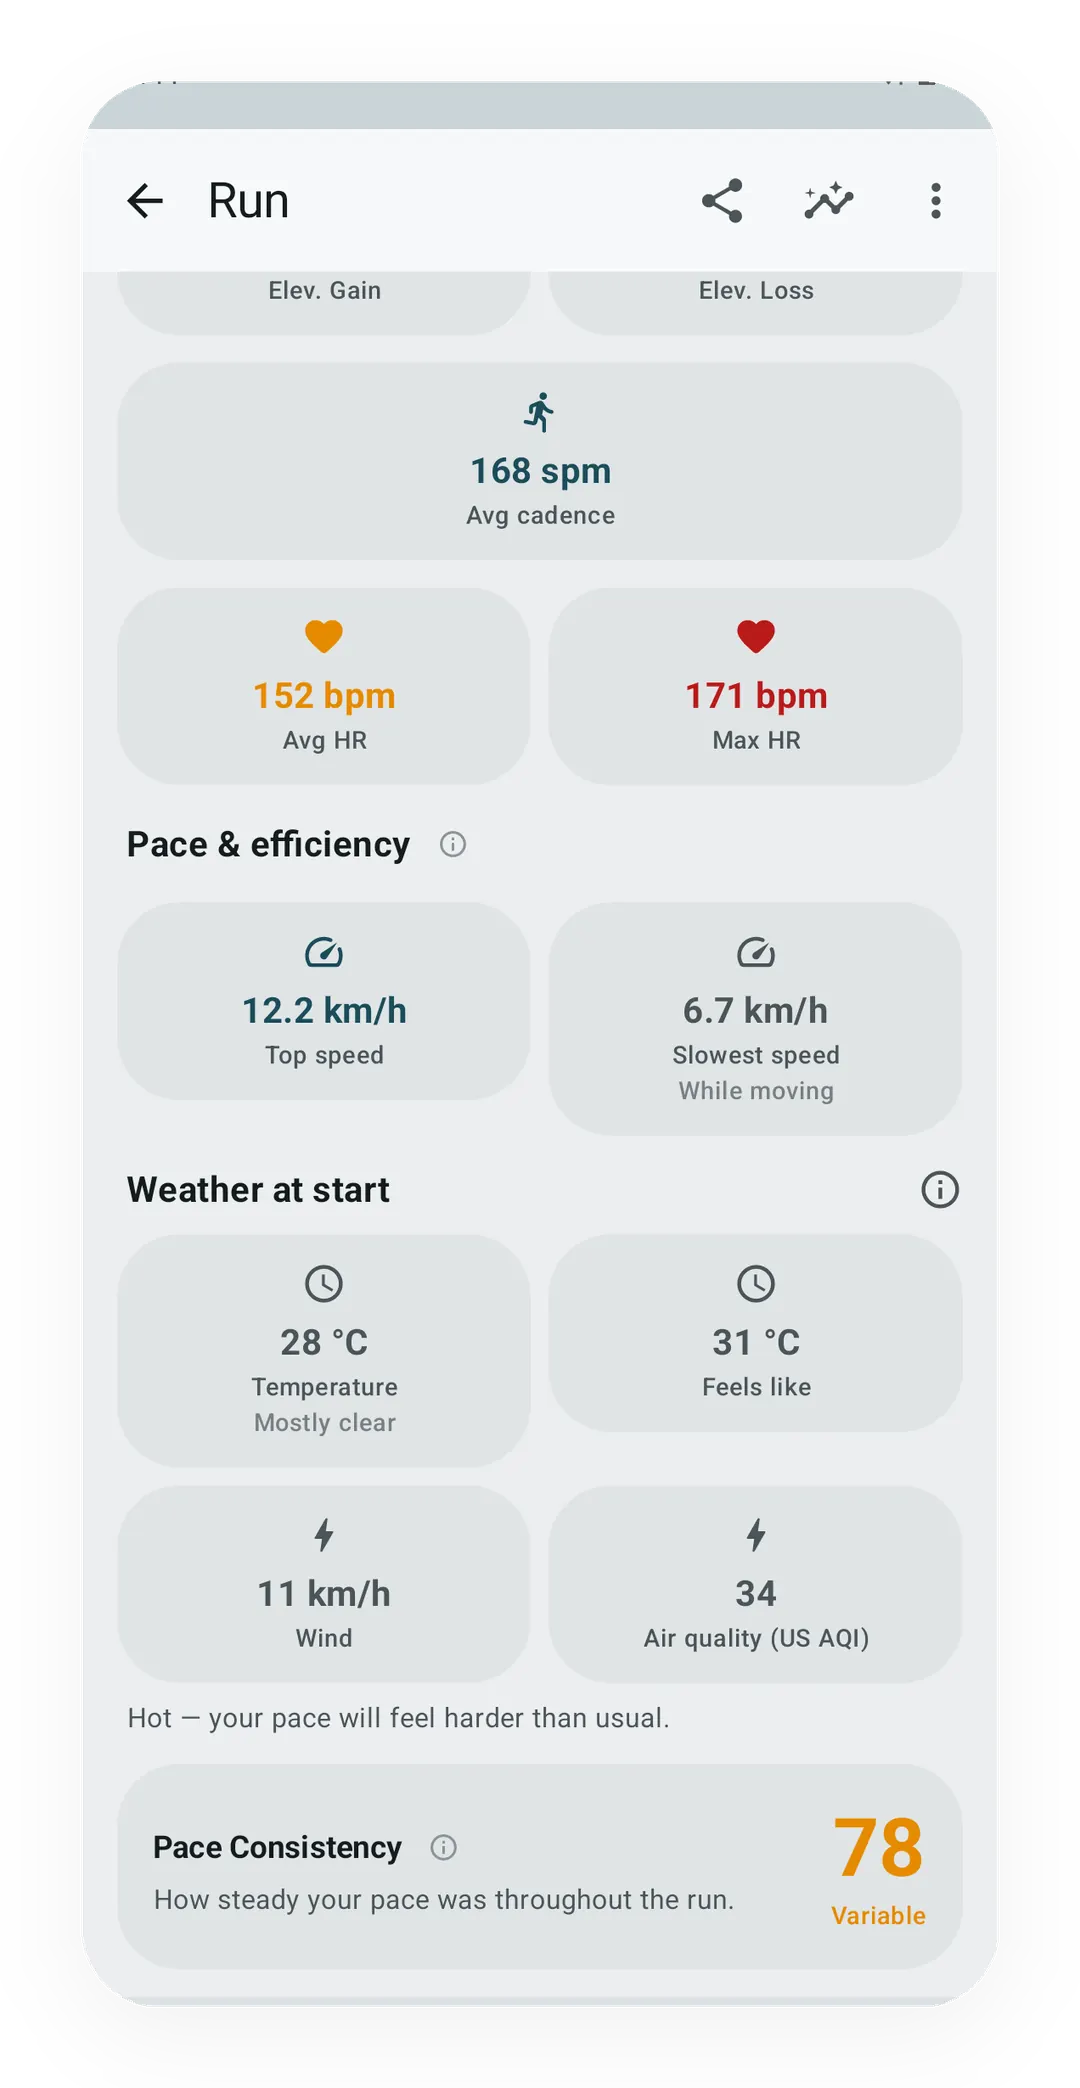
Run summary → Weather at start
This calculator estimates the pace cost of a hot day. The app records the day itself, so months later you can see the conditions a slow run happened in.
FreeFree, and off until you turn it on. Weather is the one part of a run that asks the internet, so Kinoku leaves it off and rounds your spot to about a kilometre before it asks.
Track this in the app
GPS Run Tracking
Live pace, splits, a route map, and audio cues. Your run record is not uploaded to Kinoku; map tiles load when you view maps, and weather is a clear opt-in.