

Heat and Dew Point Running Pace, Explained
How temperature and atmospheric moisture affect running pace, what the evidence can estimate, and what changes with heat acclimation.
Kinoku in practice
Where this shows up in the app
 Open full-size image ↗
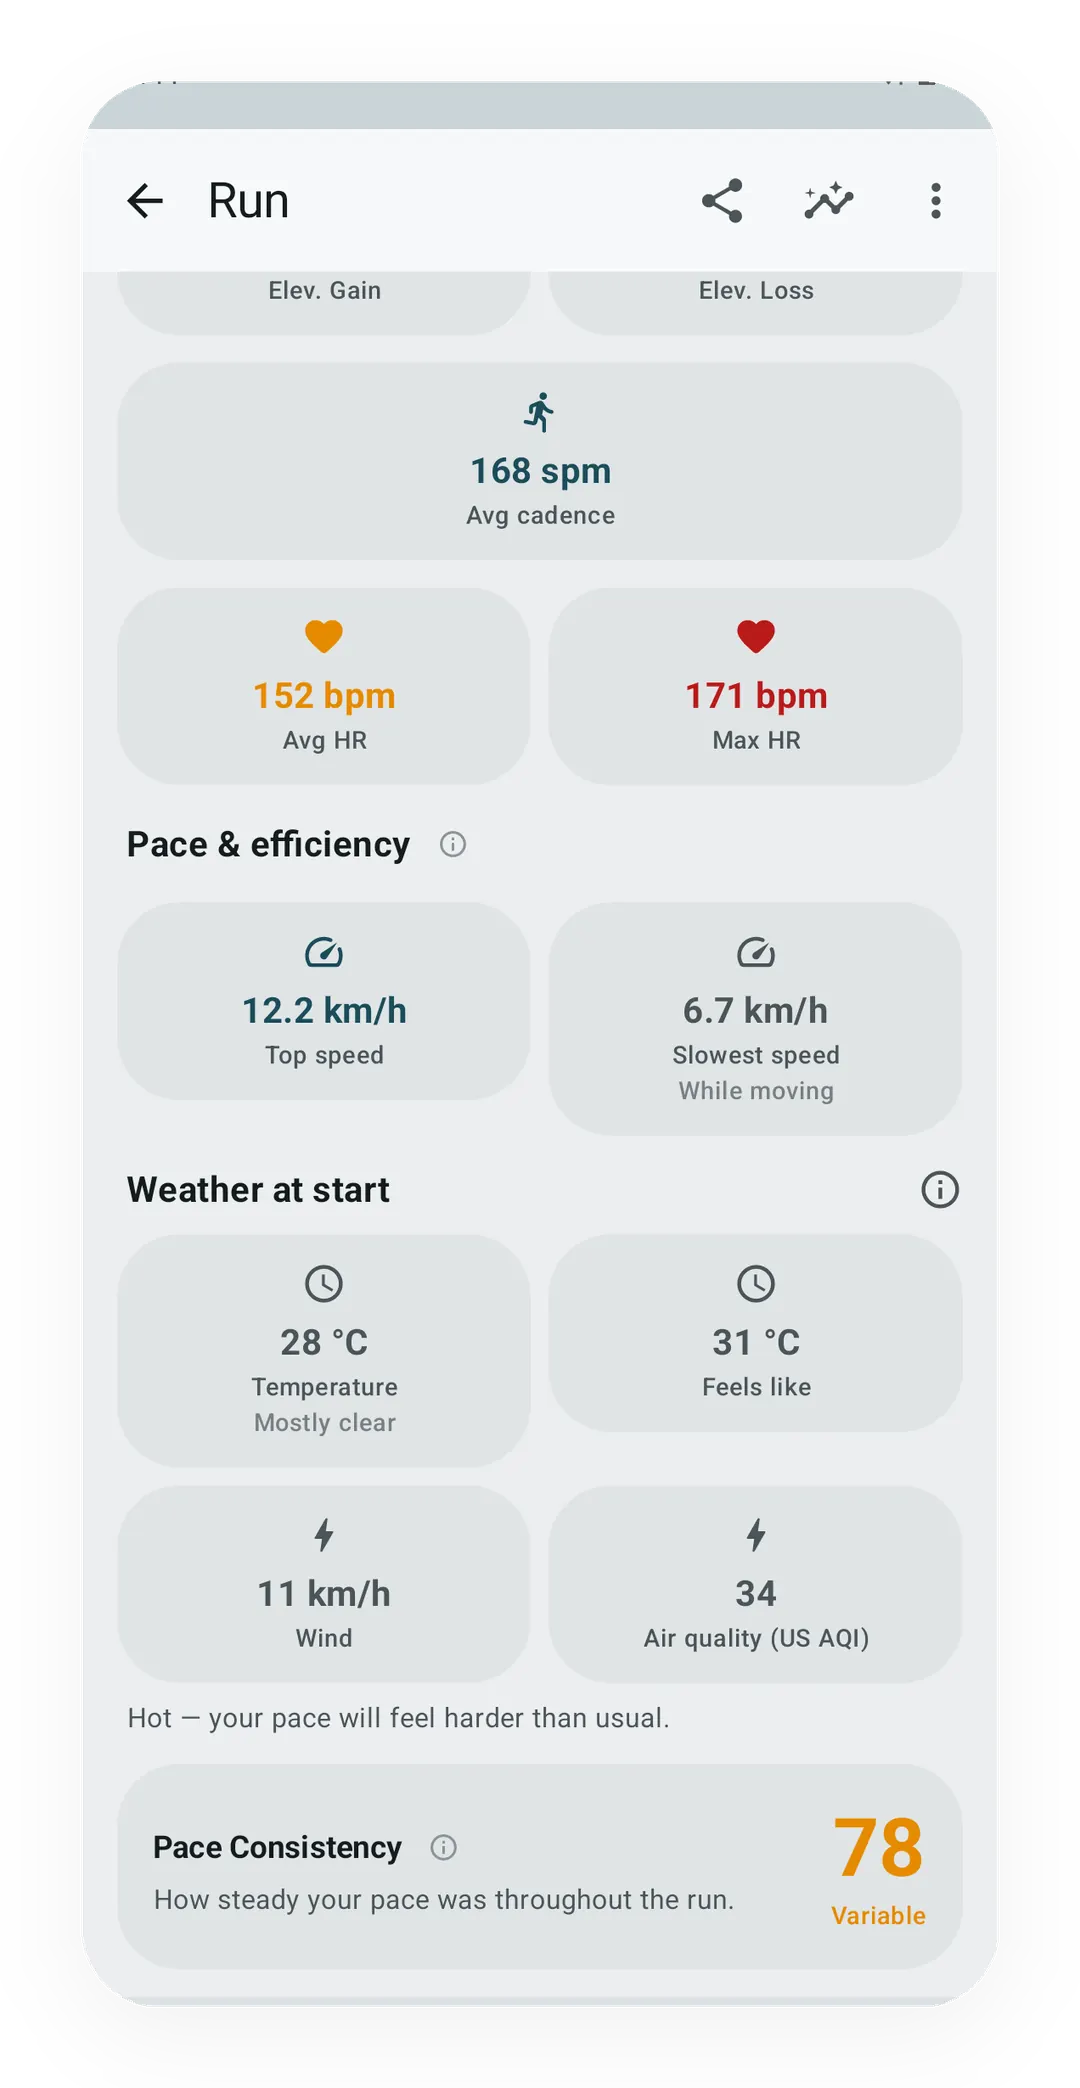
Weather beside the run
A completed run can show temperature, humidity, and heat context next to pace instead of silently changing the number.
Quickstart
Heat can cost you pace, and air temperature, atmospheric moisture, sun, wind, duration, pace, and heat acclimation all affect how much.
A rough guide for a warm day:
- Under 13 °C (55 °F) dew point: you will barely notice it
- 13 to 16 °C (55 to 60 °F): easy runs feel a bit heavier
- 16 to 20 °C (60 to 68 °F): most runners give up real pace
- Over 21 °C (70 °F): every pace feels wrong, and long runs get hard to hold
How much you lose depends on how fast you are and how long you are out, so faster runners lose the least and long runs cost the most.
The heat and dew point calculator turns a temperature and a dew point into a pace band for you.
Why dew point is more useful than relative humidity
Relative humidity is a percentage of a moving target. Warm air can hold more water than cool air, so 70% humidity at 10 °C and 70% at 30 °C are two very different mornings. The number looks the same and the run does not.
Dew point is a more direct way to express the amount of moisture in the air, and it is the temperature at which the air would start to form dew. A dew point of 20 °C represents the same moisture content whether the air temperature is mild or hot.
Cooling off explains it: you sweat, the sweat evaporates, and evaporating takes heat away with it. Air that already holds a lot of water takes your sweat much more slowly. Above roughly 20 °C dew point, sweat starts to run off you instead of evaporating, so you lose the fluid and get very little cooling back.
Two 25 °C days can feel nothing alike for this reason. A dry 25 °C with a 10 °C dew point is a pleasant run, while a muggy 25 °C with a 22 °C dew point is a slog.
What heat does while you run
Three things happen at once, and they stack.
Your blood gets divided. To lose heat you send blood to the skin, and that is blood your legs are not getting, so it is the same effort with less oxygen where you need it.
Your heart rate climbs. Less blood comes back to the heart each beat, so it beats more often to keep up, and heart rate at a set pace drifts upward through the run. Coaches call this cardiac drift.
Your core temperature rises. Working muscles make heat faster than a hot, wet day lets you shed it, and as core temperature climbs, your brain quietly cuts how hard you are willing to push. The slowdown is protection, not weakness.
None of this shows up on your watch as a reason, only as a pace that will not come down.
How much slower, in numbers
The clearest data comes from Ely and colleagues in 2007. They matched decades of finishing times from seven North American marathons against the weather on each race day. Boston, New York, Twin Cities, Grandma’s, Richmond, Hartford, and Vancouver, some going back 36 years.
They sorted the races into four bands by wet bulb globe temperature (WBGT), a heat measure that folds in humidity. Then they looked at how far off the course record each year’s winners finished.
| Race-day WBGT | Top 3 men | Top 3 women |
|---|---|---|
| 5.1 to 10 °C | 1.7% off the record | 3.2% |
| 10.1 to 15 °C | 2.5% | 3.2% |
| 15.1 to 20 °C | 3.3% | 3.8% |
| 20.1 to 25 °C | 4.5% | 5.4% |
Steady, and not very large: the leaders lost about three percent across the whole range.
Then they looked further down the field, at the 25th, 50th, 100th, and 300th finishers, and the pattern held but got much steeper. The 300th place finisher slowed around 3.2% for every 5 °C of WBGT, close to three times what the leaders gave up. A 2008 follow-up on Japanese championship marathons found the same thing.
Slower runners pay more for the same weather, for two reasons. They are out on the course far longer, so heat has more time to build. And they are usually further from the front of the pack, where the pace is set by people who have trained in these conditions all season.
That finding is the core of the calculator, which reads your own pace and scales the adjustment to match.
Where the evidence is not settled
The humidity part is less clear-cut than the running world usually admits.
Mantzios and colleagues looked at 1,258 elite races in 2022, and air temperature came out as the strongest weather signal, with no clear humidity effect at all.
That does not make dew point useless. Elite marathons finish in a bit over two hours, they run fast enough to get real cooling from the air moving past them, and they are almost never held in tropical conditions on top of that. Take a four-hour runner on a still, muggy morning and you have changed all three of those.
So read the dew point advice for what it is: strong for long, slower efforts, and weaker at the sharp end of the field. Anyone who tells you the science here is settled has not read much of it.
Getting used to the heat changes everything
Heat acclimation is one of the most reliable adaptations in sport. Périard and colleagues reviewed what happens: you start sweating sooner, you sweat more, your sweat holds onto less salt, your blood volume goes up, and your heart rate at a given pace comes down.
Most of it lands in about 10 to 14 days of regular training in the heat, and it fades over a few weeks once you stop.
This is the single biggest reason your real number will not match a calculator. Two runners at the same pace on the same morning can be a long way apart if one has spent three weeks in it and the other just flew in.
The calculator has no way to know which one you are, so its answer sits in the middle of a range that is wider than you would like.
Effort beats pace on a hot day
The honest version of all this is simple: on a hot day, pace stops being a good measure of how hard you are working.
Some options runners use:
- Going by feel. The effort you would call easy is still easy. It is just slower.
- Heart rate, read with room for the heat. It runs high on a hot day. A few beats above normal for the pace is expected.
- A different hour. Air temperature often bottoms out near dawn, but dew point may change little or follow a different pattern. Check the hourly temperature, dew point, sun, and wind rather than assuming one time is always best.
- Two shorter runs. Splitting a long one costs less than holding it together in the heat.
A calculator is for setting expectations before you head out. Once you are running, your body has better information than the maths does.
What the calculator does and does not do
It takes air temperature and dew point, estimates a wet bulb globe temperature with the American College of Sports Medicine’s shortcut formula, then applies the Ely slope scaled to your pace and the length of your run. The mild, warm, hot and very hot bands are ACSM’s own flag categories for road races. Every step is written out on the tool page.
What it leaves out:
- Sun and wind. The heat estimate is a shade figure, so open road at noon is harder than it says.
- Whether you are used to the heat.
- Anything above 25 °C WBGT, where the marathon data runs out.
- Short, fast sessions. The research is marathon data, scaled down by our own estimate.
If you want a second opinion, Running Writings fits a different model to 3,891 marathon runners across 754 races and shows its work. Two honest models will not always agree, and the gap between them is a fair measure of how sure anyone can be.
Track this in Kinoku
GPS run tracking is free in Kinoku, and turning on weather context stores the temperature and wind next to each run’s splits. A second toggle adds air quality, pollen, and UV (the sun’s ultraviolet rays), and your location is rounded to about 1.1 km before that request, so the weather service never sees your real route.
The point is context you can still read months later. A slow August long run looks like a bad session in a list of times. With the conditions attached, it looks like what it was.
Kinoku does not rewrite your pace targets for the weather, and it does not change your plan behind your back. It records what the day was like, and what you do about it is yours.
You can also run the numbers here without installing anything, in the heat and dew point calculator.
References
Track this in the app
GPS Run Tracking
Live pace, splits, a route map, and audio cues. Your run record is not uploaded to Kinoku; map tiles load when you view maps, and weather is a clear opt-in.
Core tracking works offline, with no mandatory account.
Related features
Live pace, splits, a route map, and audio cues. Your run record is not uploaded to Kinoku; map tiles load when you view maps, and weather is a clear opt-in.
Offline run breakdown with splits, a fitness score from your runs, a pacing score, best efforts, race forecasts, and a compare card that stacks each run against your similar past runs.
A deep look at one run. Pace, heart rate, and climb on linked charts you can pinch to zoom. Tap the route to jump to that moment, and read marks for your peaks, fastest splits, and fatigue points. The whole screen is free. Pro adds replay, ghost-compare against another run, your own notes, and still-frame MP4 export.