

Running Pace and Race Predictions, Explained
How to convert pace, time and distance, read even splits, and use Riegel race estimates with clear limits on longer distances.
Kinoku in practice
Where this shows up in the app
 Open full-size image ↗
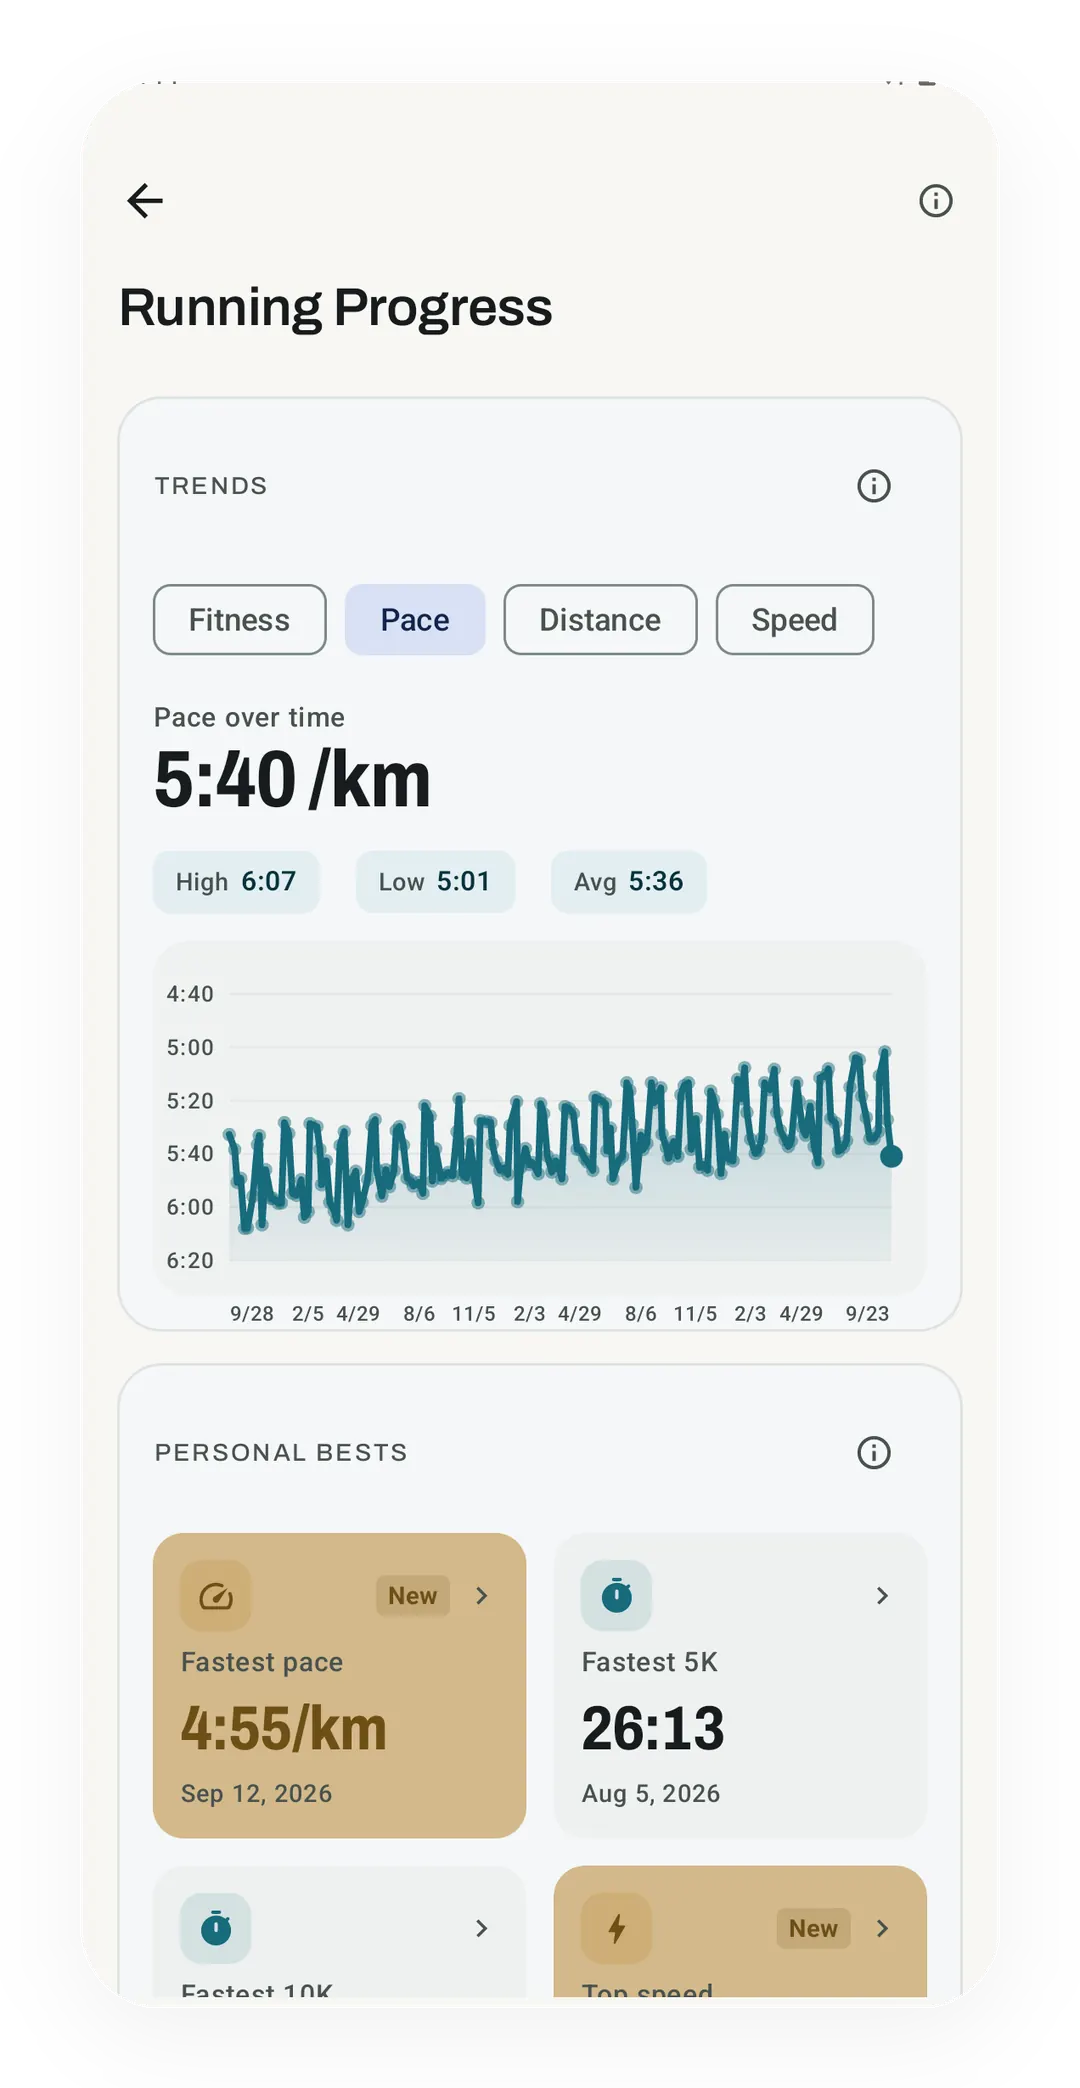
Pace over time in free Running Progress
Fictional sample history shows the latest pace at 5:40 per kilometre, with a 26:13 fastest 5K below the chart. Running Progress is free.
Running pace is the time needed to cover one kilometre or mile, while a race forecast gives a likely finish at another distance. Pace uses exact maths from your inputs. A forecast also assumes how long you can hold your speed, so it deserves less trust when a short race feeds a marathon guess.
The pace tool handles both jobs, with a split table that shows how the maths works. This article follows a 25-minute run over five kilometres, so the gap between a pace and a race forecast stays clear.
What does 5:00 per kilometre mean?
A pace of 5:00 per kilometre means each km takes five minutes, giving a 25:00 finish over five km. Running pace uses a minutes:seconds format, while a longer finish time may include hours as well. A pace of 4:30 is faster than 5:00 because less time passes over the same distance.
The maths divides total time by distance, with both values in matching units before the answer is shown. Our example takes 1,500 seconds over five km, which gives 300 seconds per km, or 5:00.
The same pace is about 8:03 per mile because a mile covers exactly 1.609344 km. Changing the unit changes the number on the screen, while the run itself and its finish time stay the same.
How do pace, time and distance fit together?
Pace, time and distance follow one rule, so any two give you the third without a race forecast model.
| The value you need | The calculation | Example |
|---|---|---|
| Pace | Time divided by distance | 25:00 over 5 km gives 5:00/km. |
| Time | Pace multiplied by distance | 5:00/km over 5 km gives 25:00. |
| Distance | Time divided by pace | 25:00 at 5:00/km gives 5 km. |
The tool lets you choose the missing value, leaving two inputs to fill in rather than three competing answers. Time needs a colon between minutes and seconds, so 25:00 means twenty-five minutes rather than twenty-five seconds.
A finish target and a forecast answer different questions, even when they happen to print the same time. The tool can show the pace needed for a chosen finish, but the maths cannot show how long you could hold it.
What do even splits tell you?
Even splits show the time at each checkpoint if your average pace stays the same throughout the whole distance. At 5:00 per km, our example reaches one km at 5:00 and three km at 15:00, before finishing at 25:00.
A half marathon ends at 21.0975 km, while a full marathon ends at 42.195 km. The table includes the last part of a km or mile, so its final row reaches the full race distance rather than stopping short. For a marathon, our marathon pace chart lists the pace and the splits for every finish from 2:30 to 6:00.
Each checkpoint is rounded to the nearest second after the maths, keeping the finish based on the full distance. Adding rounded split times can therefore differ from the rounded finish, because each row may round up or down.
Even pacing is a guide for reading the numbers, rather than a claim that every course rewards the same splits. Hills or weather can change the effort needed to hold that pace, which the maths itself does not measure. The heat and dew point tool looks at weather on its own, with its sources and limits attached.
How does the Riegel race estimate work?
Pete Riegel’s race model scales a known time by the ratio between two race distances, raised to a power. The web tool uses 1.06 for that power, matching the Riegel part of Kinoku’s app engine, and prints it beside the formula.
Predicted time = source time × (target distance ÷ source distance)^1.06Our 25:00 five-km run gives about 52:07 for ten km, rather than the 50:00 that doubling its time would produce. The extra time comes from the power, which builds slower average pace over a longer distance into the estimate.
That result assumes the source is a useful race effort and the runner is trained to cover the target distance. An easy training run answers a different question from a recent race, so its time can give the model a weak starting point.
Riegel’s own later notes describe the simple model’s range as the mile through the marathon. The tool leaves the forecast blank when the source sits outside that range, while still working out pace from the inputs.
What does the five percent range mean?
The shown range takes five percent off and adds five percent to the estimate, using Kinoku’s rule for a single model. The margin gives an example of how times could differ, rather than a measured confidence interval or a promise about where you will finish.
For the example’s ten-kilometre forecast, that margin gives about 49:31 to 54:44 around the 52:07 estimate. Those endpoints make the assumption easier to see, but a real finish can fall outside either one.
A range cannot supply the training history that the formula lacks, especially when a short race feeds a much longer forecast. The forecast gets weaker as the target race gets longer than the source, so a marathon number needs more care than a nearby distance.
Why can a marathon forecast look too fast?
A marathon forecast can look too fast because speed in a short race does not fully describe speed over a marathon. The simple formula only reads a time and two distances, leaving it unable to read the training behind either effort.
Vickers and Vertosick’s 2016 study studied non-elite runners and found that the model often predicted marathon times that were too fast. The main test used 1.07, and the authors also checked 1.06 and 1.08 without changing their wider finding.
The study supports a warning about long-distance forecasts, but its errors do not prove this tool’s five percent range. Claiming that range as your personal odds would give the formula knowledge about you that it does not have.
Where do Boston qualifying standards fit?
Boston qualifying standards are entry rules, which a race forecast cannot prove that a runner has met. The tool’s 2027 table links the official source and includes the downhill review rules alongside the times.
Entry for that race closed in September 2026, so the table describes a past window rather than a current invitation. The association’s qualifying page remains the source for the rule and any later update. Our page on Boston qualifying times for 2027 lists each age group’s standard, the pace it needs and every cutoff since 2012.
How does Kinoku put pace in context?
Kinoku’s free Running Progress screen puts pace trends beside personal bests from the runs saved on your phone. Each record links back to the run that set it, making a quick day easier to compare with the weeks around it.
Race Predictions in Run Analytics is a Pro feature, with estimates for four distances and a count of the models used. The app can combine more than the web page’s single Riegel estimate when enough data is present, so the two results can differ.
Kinoku is on Android, and the app’s estimates run on your phone without a Kinoku account. The web tool remains useful on its own when you only need a pace or a split table.
Track this in the app
Running Progress
Your run records and whether you are getting faster, over time. It reads your best efforts and a fitness estimate, never plain average pace, and only claims progress when the trend is sure.
Core tracking works offline, with no mandatory account.
Related features
Your run records and whether you are getting faster, over time. It reads your best efforts and a fitness estimate, never plain average pace, and only claims progress when the trend is sure.
Offline run breakdown with splits, a fitness score from your runs, a pacing score, best efforts, race forecasts, and a compare card that stacks each run against your similar past runs.
Live pace, splits, a route map, and audio cues. Your run record is not uploaded to Kinoku; map tiles load when you view maps, and weather is a clear opt-in.