

Marathon Pace Chart: Pace per Mile and per Km, With Splits
Every marathon finish from 2:30 to 6:00 in five-minute steps, with the pace per mile and per km it needs and the splits at 5 km, 10 km, halfway and 20 miles.
Kinoku in practice
Where this shows up in the app
 Open full-size image ↗
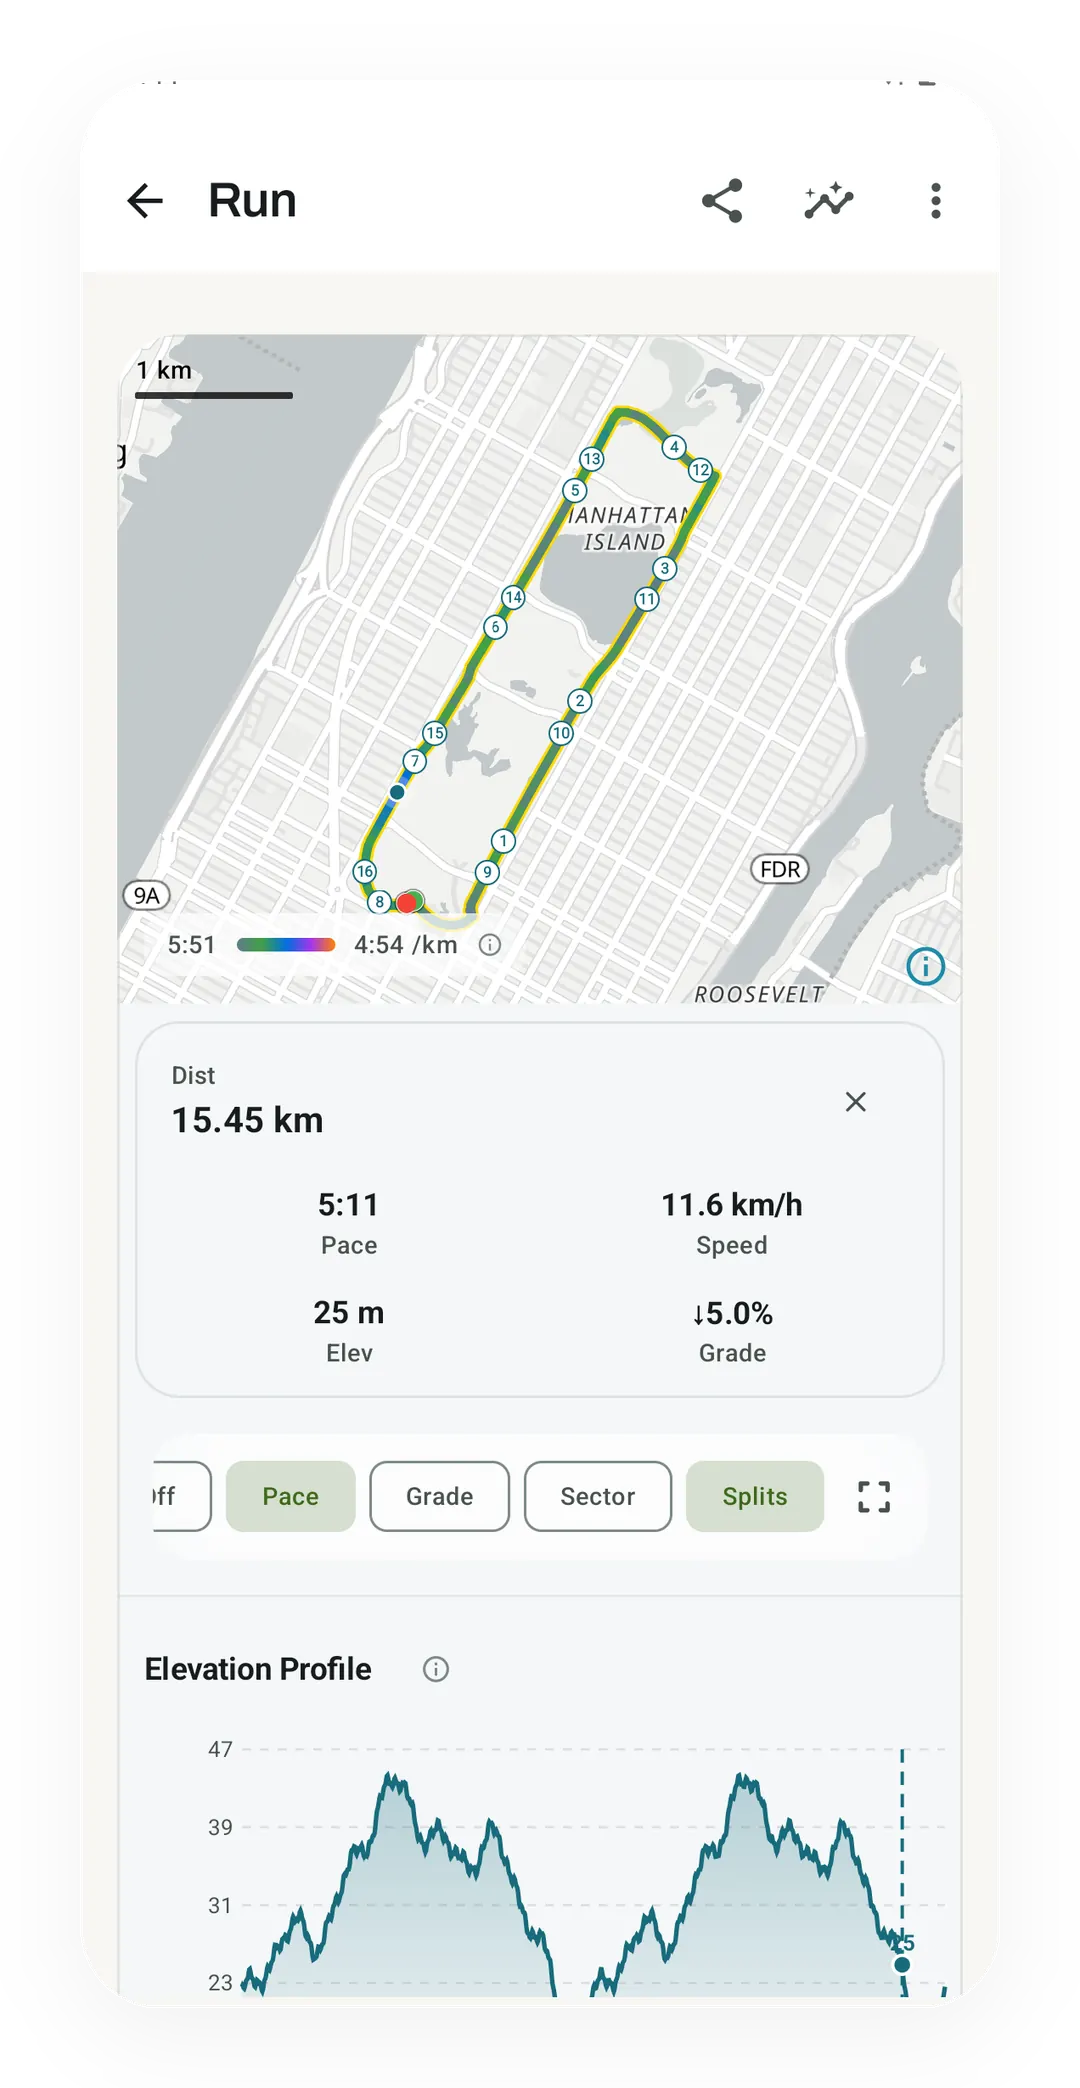
Splits on a recorded run
This capture uses demo data. The run map colors the route by pace, from 5:51 to 4:54 per km, and numbers each split. A tap on the line reads out one point, 15.45 km in at a 5:11 pace. Recording a GPS run is free.
A marathon pace chart lists the average pace each finish time needs over 42.195 km, or about 26.2 miles, so a four-hour marathon works out to 5:41 per kilometre or 9:09 per mile.
Marathon pace chart per kilometre and per mile
| Finish time | Pace per km | Pace per mile |
|---|---|---|
| 2:30:00 | 3:33 | 5:43 |
| 2:35:00 | 3:40 | 5:55 |
| 2:40:00 | 3:48 | 6:06 |
| 2:45:00 | 3:55 | 6:18 |
| 2:50:00 | 4:02 | 6:29 |
| 2:55:00 | 4:09 | 6:40 |
| 3:00:00 | 4:16 | 6:52 |
| 3:05:00 | 4:23 | 7:03 |
| 3:10:00 | 4:30 | 7:15 |
| 3:15:00 | 4:37 | 7:26 |
| 3:20:00 | 4:44 | 7:38 |
| 3:25:00 | 4:52 | 7:49 |
| 3:30:00 | 4:59 | 8:01 |
| 3:35:00 | 5:06 | 8:12 |
| 3:40:00 | 5:13 | 8:23 |
| 3:45:00 | 5:20 | 8:35 |
| 3:50:00 | 5:27 | 8:46 |
| 3:55:00 | 5:34 | 8:58 |
| 4:00:00 | 5:41 | 9:09 |
| 4:05:00 | 5:48 | 9:21 |
| 4:10:00 | 5:55 | 9:32 |
| 4:15:00 | 6:03 | 9:44 |
| 4:20:00 | 6:10 | 9:55 |
| 4:25:00 | 6:17 | 10:06 |
| 4:30:00 | 6:24 | 10:18 |
| 4:35:00 | 6:31 | 10:29 |
| 4:40:00 | 6:38 | 10:41 |
| 4:45:00 | 6:45 | 10:52 |
| 4:50:00 | 6:52 | 11:04 |
| 4:55:00 | 6:59 | 11:15 |
| 5:00:00 | 7:07 | 11:27 |
| 5:05:00 | 7:14 | 11:38 |
| 5:10:00 | 7:21 | 11:49 |
| 5:15:00 | 7:28 | 12:01 |
| 5:20:00 | 7:35 | 12:12 |
| 5:25:00 | 7:42 | 12:24 |
| 5:30:00 | 7:49 | 12:35 |
| 5:35:00 | 7:56 | 12:47 |
| 5:40:00 | 8:03 | 12:58 |
| 5:45:00 | 8:11 | 13:10 |
| 5:50:00 | 8:18 | 13:21 |
| 5:55:00 | 8:25 | 13:32 |
| 6:00:00 | 8:32 | 13:44 |
The chart covers every finish from 2:30 to 6:00 in five-minute steps, with each pace rounded to the nearest second. Our free pace calculator rounds the same way and handles any time between two rows, with a split for every kilometre or mile, and it runs in your browser with no account.
Marathon split times at 5 km, 10 km, halfway, 30 km and 20 miles
| Finish time | 5 km | 10 km | Half | 30 km | 20 miles |
|---|---|---|---|---|---|
| 2:30:00 | 17:46 | 35:33 | 1:15:00 | 1:46:39 | 1:54:25 |
| 2:35:00 | 18:22 | 36:44 | 1:17:30 | 1:50:12 | 1:58:14 |
| 2:40:00 | 18:58 | 37:55 | 1:20:00 | 1:53:45 | 2:02:03 |
| 2:45:00 | 19:33 | 39:06 | 1:22:30 | 1:57:19 | 2:05:52 |
| 2:50:00 | 20:09 | 40:17 | 1:25:00 | 2:00:52 | 2:09:41 |
| 2:55:00 | 20:44 | 41:28 | 1:27:30 | 2:04:25 | 2:13:30 |
| 3:00:00 | 21:20 | 42:40 | 1:30:00 | 2:07:59 | 2:17:18 |
| 3:05:00 | 21:55 | 43:51 | 1:32:30 | 2:11:32 | 2:21:07 |
| 3:10:00 | 22:31 | 45:02 | 1:35:00 | 2:15:05 | 2:24:56 |
| 3:15:00 | 23:06 | 46:13 | 1:37:30 | 2:18:39 | 2:28:45 |
| 3:20:00 | 23:42 | 47:24 | 1:40:00 | 2:22:12 | 2:32:34 |
| 3:25:00 | 24:18 | 48:35 | 1:42:30 | 2:25:45 | 2:36:23 |
| 3:30:00 | 24:53 | 49:46 | 1:45:00 | 2:29:18 | 2:40:11 |
| 3:35:00 | 25:29 | 50:57 | 1:47:30 | 2:32:52 | 2:44:00 |
| 3:40:00 | 26:04 | 52:08 | 1:50:00 | 2:36:25 | 2:47:49 |
| 3:45:00 | 26:40 | 53:19 | 1:52:30 | 2:39:58 | 2:51:38 |
| 3:50:00 | 27:15 | 54:31 | 1:55:00 | 2:43:32 | 2:55:27 |
| 3:55:00 | 27:51 | 55:42 | 1:57:30 | 2:47:05 | 2:59:16 |
| 4:00:00 | 28:26 | 56:53 | 2:00:00 | 2:50:38 | 3:03:05 |
| 4:05:00 | 29:02 | 58:04 | 2:02:30 | 2:54:11 | 3:06:53 |
| 4:10:00 | 29:37 | 59:15 | 2:05:00 | 2:57:45 | 3:10:42 |
| 4:15:00 | 30:13 | 1:00:26 | 2:07:30 | 3:01:18 | 3:14:31 |
| 4:20:00 | 30:49 | 1:01:37 | 2:10:00 | 3:04:51 | 3:18:20 |
| 4:25:00 | 31:24 | 1:02:48 | 2:12:30 | 3:08:25 | 3:22:09 |
| 4:30:00 | 32:00 | 1:03:59 | 2:15:00 | 3:11:58 | 3:25:58 |
| 4:35:00 | 32:35 | 1:05:10 | 2:17:30 | 3:15:31 | 3:29:46 |
| 4:40:00 | 33:11 | 1:06:22 | 2:20:00 | 3:19:05 | 3:33:35 |
| 4:45:00 | 33:46 | 1:07:33 | 2:22:30 | 3:22:38 | 3:37:24 |
| 4:50:00 | 34:22 | 1:08:44 | 2:25:00 | 3:26:11 | 3:41:13 |
| 4:55:00 | 34:57 | 1:09:55 | 2:27:30 | 3:29:44 | 3:45:02 |
| 5:00:00 | 35:33 | 1:11:06 | 2:30:00 | 3:33:18 | 3:48:51 |
| 5:05:00 | 36:09 | 1:12:17 | 2:32:30 | 3:36:51 | 3:52:39 |
| 5:10:00 | 36:44 | 1:13:28 | 2:35:00 | 3:40:24 | 3:56:28 |
| 5:15:00 | 37:20 | 1:14:39 | 2:37:30 | 3:43:58 | 4:00:17 |
| 5:20:00 | 37:55 | 1:15:50 | 2:40:00 | 3:47:31 | 4:04:06 |
| 5:25:00 | 38:31 | 1:17:01 | 2:42:30 | 3:51:04 | 4:07:55 |
| 5:30:00 | 39:06 | 1:18:12 | 2:45:00 | 3:54:37 | 4:11:44 |
| 5:35:00 | 39:42 | 1:19:24 | 2:47:30 | 3:58:11 | 4:15:33 |
| 5:40:00 | 40:17 | 1:20:35 | 2:50:00 | 4:01:44 | 4:19:21 |
| 5:45:00 | 40:53 | 1:21:46 | 2:52:30 | 4:05:17 | 4:23:10 |
| 5:50:00 | 41:28 | 1:22:57 | 2:55:00 | 4:08:51 | 4:26:59 |
| 5:55:00 | 42:04 | 1:24:08 | 2:57:30 | 4:12:24 | 4:30:48 |
| 6:00:00 | 42:40 | 1:25:19 | 3:00:00 | 4:15:57 | 4:34:37 |
Each split is the clock time at that point for a runner who holds the chart’s pace from the start line to the finish. The half column is always exactly half the finish time, which makes it the quickest check on race day.
How the marathon pace chart is worked out
Every value in both charts comes from one rule, which spreads the finish time evenly over the race distance.
Pace per km   = finish time in seconds ÷ 42.195
Pace per mile = finish time in seconds ÷ 26.2188
Split time    = finish time × (split distance ÷ race distance)
Take a 4:00:00 finish as the worked example. That is 14,400 seconds, and dividing by 42.195 gives 341.3 seconds, which rounds to 5:41 per kilometre. Dividing by 26.2188 gives 549.2 seconds instead, or 9:09 per mile. Twenty miles is 32.19 km, so the 20-mile split for the same runner lands at 3:03:05.
The marathon is 42.195 km, and a mile is exactly 1.609344 km, which makes the race 26.2188 miles to four decimal places. Race signs and most charts shorten that to 26.2, and the shorter figure is close enough for planning a race.
Why a rounded pace can miss a goal by a few seconds
Every pace on a chart is rounded to the second, and over a full marathon one second per mile adds up to about 26 seconds. The exact pace for a 3:00:00 finish is 6:51.9 per mile, so a runner who holds the rounded 6:52 all the way crosses the line at 3:00:02. Holding 4:16 per kilometre gives the same result.
That gap matters most when the goal is a hard line, such as a Boston qualifying standard or breaking three hours. A pace one second faster than the chart leaves a margin, since 6:51 per mile comes to 2:59:36 and 4:15 per kilometre comes to 2:59:20.
Marathon pace strategy: what race data shows
Even pacing means running every part of the race at the same speed, and both charts above assume it. Large studies of race results find that runners, on average, slow down in the second half instead.
Deaner and colleagues looked at 91,929 finishes from 14 US marathons in 2011. On average, men’s pace in the second half was 15.6 percent slower than in the first half, and women’s was 11.7 percent slower. Slower finishing times went with more slowing, while runners with more marathons behind them slowed less.
Santos-Lozano and colleagues studied 190,228 New York City Marathon finishers from 2006 to 2011. They wrote that “all runners developed a positive pace profile”, which means each group of runners took longer over the later part of the race. The top runners’ speed varied the least from one 5 km split to the next.
The worked example shows what that slowdown does to a 4:00:00 goal. A runner who slows by the men’s average of 15.6 percent and still finishes in 4:00:00 has to reach halfway in about 1:51:19, close to 5:17 per kilometre. An even race reaches halfway at 2:00:00 at 5:41 per kilometre, so the same finish time asks for two very different first halves.
A negative split, where the second half is faster than the first, is the reverse of that pattern. Both studies looked at results from past races, so they describe how runners paced rather than testing which plan gives one runner a faster finish.
Where a pace chart stops helping
A chart answers one question, which is the pace a finish time needs. Whether that pace is realistic for you depends on your training and recent races. Our race pace explainer covers race estimates, and why a marathon estimate from a short race can look too fast.
Hills and heat change how hard a given pace feels, while the chart treats every kilometre as flat and cool. The heat and dew point pace tool looks at the weather side, with its sources and limits.
For the Boston Marathon’s standards by age, with the pace each one needs and the 2027 cutoff, our page on Boston qualifying times for 2027 has the full tables.
Track your marathon training in Kinoku
Kinoku records GPS runs on your phone for free, with live pace, splits, a route map and audio cues. Running Progress, also free, charts your pace over time and keeps personal bests such as your fastest 5K and 10K. A run planned on the training calendar can carry a target distance and a target pace, and planning is free as well.
Race Predictions is part of Pro. It estimates a 5K, 10K, half marathon and marathon from the runs saved on your phone, showing a range and a count of the models behind each estimate. An estimate is a guide for training rather than a promise about race day. Kinoku runs on Android only, and it needs no account.
Common questions
What pace is a 4-hour marathon?
A 4:00:00 marathon needs an average of 5:41 per kilometre or 9:09 per mile. At that even pace you pass halfway at 2:00:00, 30 km at 2:50:38 and 20 miles at 3:03:05. The chart on this page lists every finish from 2:30 to 6:00 in five-minute steps.
What pace do you need for a sub-3-hour marathon?
A 3:00:00 finish needs 6:51.9 per mile, which a chart rounds to 6:52, or 4:16 per kilometre. Holding either rounded pace for the whole race finishes at 3:00:02. A pace of 6:51 per mile comes to 2:59:36, so a goal of breaking three hours sits one second per mile faster than the chart.
How long is a marathon in miles?
A marathon is 42.195 km, and a mile is exactly 1.609344 km, so the race is 26.2188 miles, which signs and charts round to 26.2. This page works out every pace and split from those two distances, the same way the free Kinoku pace calculator does.
Is it better to run even splits or a negative split in a marathon?
In large studies of race results, runners on average ran the second half slower than the first. In 91,929 finishes from 14 US marathons, men's second-half pace averaged 15.6 percent slower and women's 11.7 percent slower. In New York City Marathon results, the fastest runners' speed changed the least during the race. The chart on this page assumes an even pace from start to finish.
How do I work out a marathon pace for a time that is not in the chart?
The free Kinoku pace calculator takes any finish time and distance and works out the pace per kilometre or per mile, with a split for every kilometre or mile. It rounds to the nearest second, as this chart does, and it runs in your browser with no account.
Can Kinoku track my marathon pace?
Kinoku records GPS runs for free on Android, with live pace, splits and audio cues, and Running Progress charts your pace over time. Race Predictions, part of Pro, estimates a marathon time from the runs saved on your phone, with a range and a count of the models it used. An estimate is a guide for training rather than a promise about race day, and Kinoku runs on Android only.
Track this in the app
GPS Run Tracking
Live pace, splits, a route map, and audio cues. Your run record is not uploaded to Kinoku; map tiles load when you view maps, and weather is a clear opt-in.
Core tracking works offline, with no mandatory account.
Related features
Live pace, splits, a route map, and audio cues. Your run record is not uploaded to Kinoku; map tiles load when you view maps, and weather is a clear opt-in.
Your run records and whether you are getting faster, over time. It reads your best efforts and a fitness estimate, never plain average pace, and only claims progress when the trend is sure.
Offline run breakdown with splits, a fitness score from your runs, a pacing score, best efforts, race forecasts, and a compare card that stacks each run against your similar past runs.
Plan workouts on one calendar, with no limit on how many plans you keep or how far ahead you plan. Pro adds repeating schedules (weekly, custom days, or every few weeks), drag-to-move, bring-to-today, repeat-day, and day copy.