

Strength Standards by Body Weight: DOTS Percentiles
DOTS percentile tables for men and women, built from OpenPowerlifting raw tested meet totals, 2020 to 2024. The same reference file Kinoku ships.
Kinoku in practice
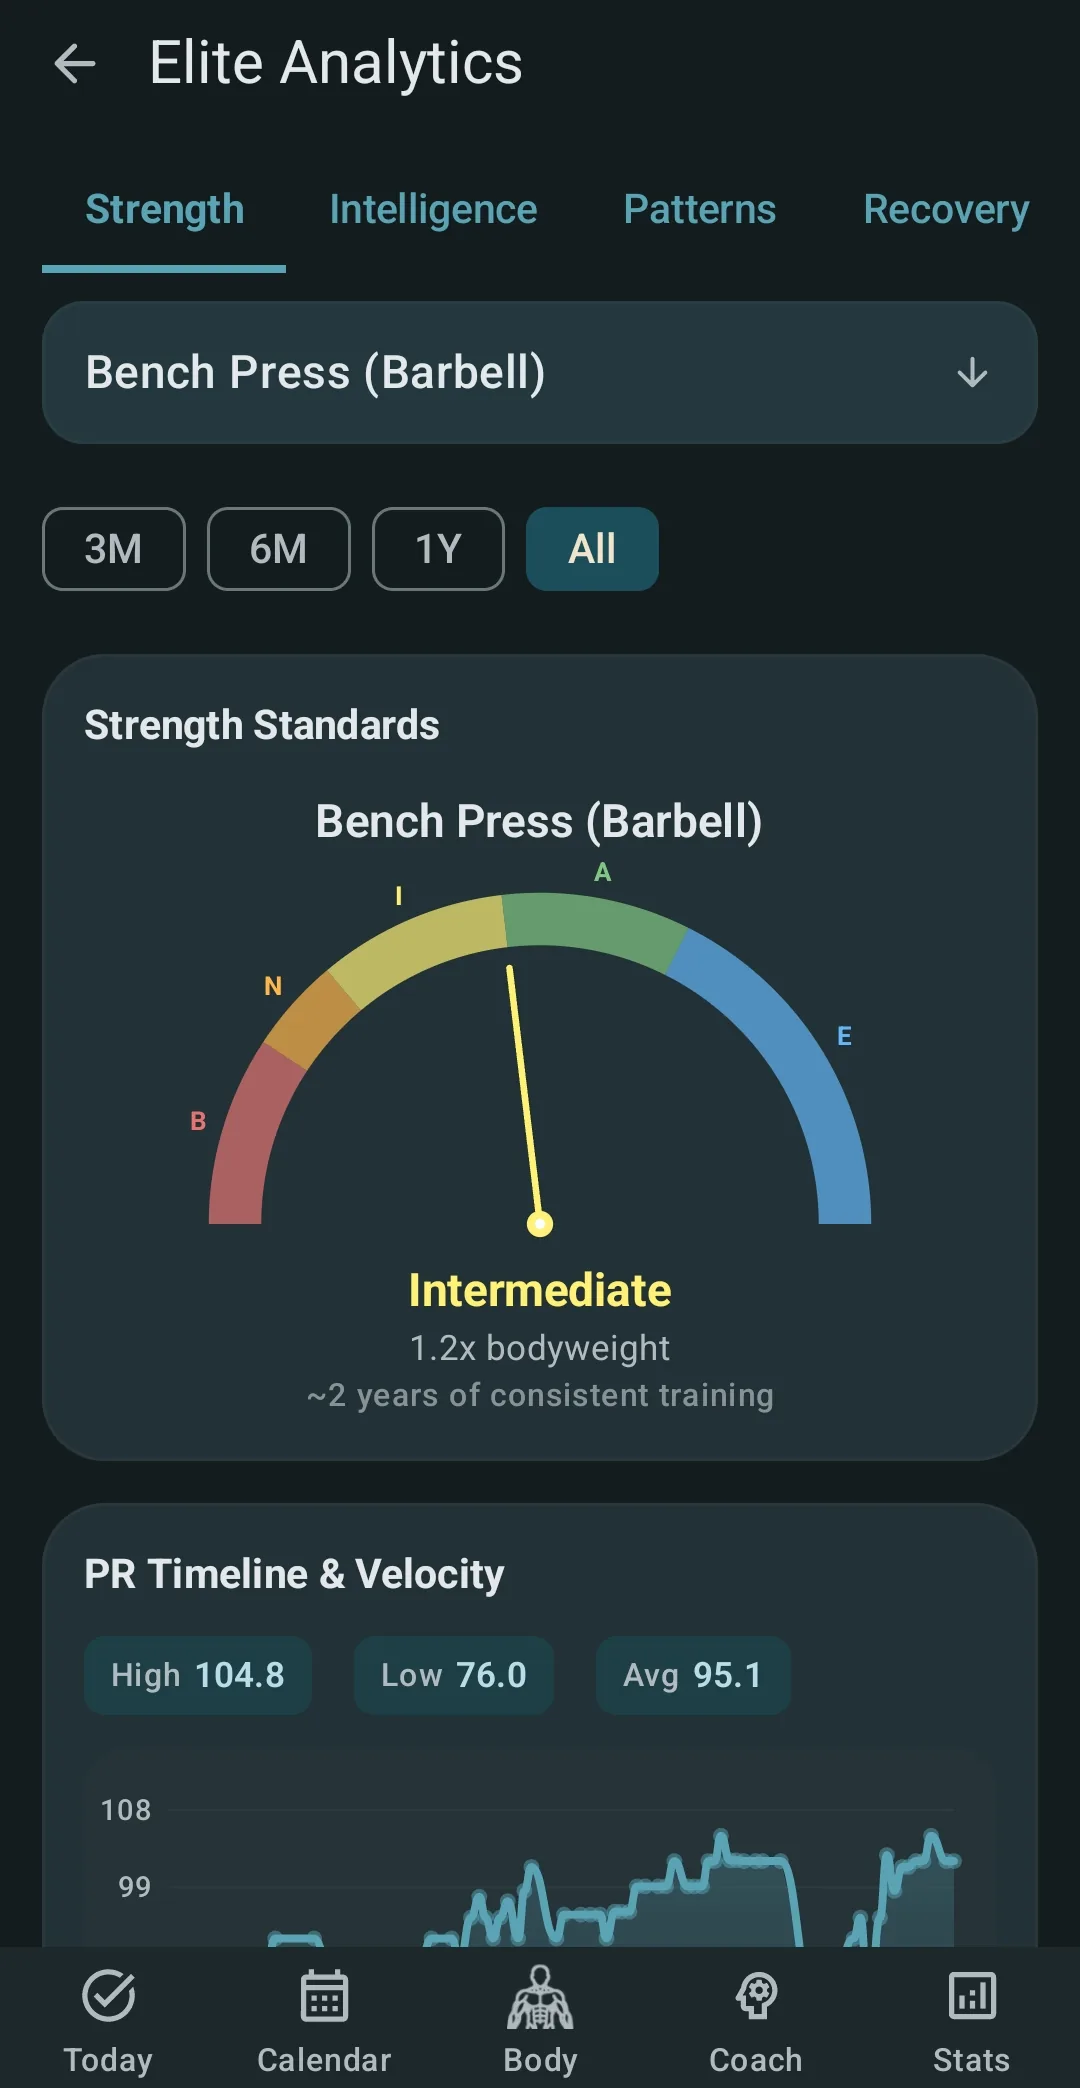
Where this shows up in the app
 Open full-size image ↗
Percentile chips beside each score
The Strength Standards surface prints a percentile chip next to the DOTS score. The chip is read from the tables on this page.
Quickstart
DOTS (a formula that scores lifting strength across body weights) puts lifters of every size on one scale, and the two tables here turn a DOTS score into a percentile, one table for men and one for women. The rows come from a reference file that ships inside Kinoku, built from OpenPowerlifting meet results: raw classic totals, tested federations, 2020 to 2024. So the crowd you are ranked against is people who compete, rather than everyone who lifts.
How to read these tables
Find the row closest to your DOTS score, where the percentile is the share of lifters in the reference set who scored at or below that DOTS. A man at DOTS 340 sits at the 50th percentile, so half the men in the set scored lower than him and half scored higher.
Your score will rarely land on a row, so Kinoku draws a straight line between the two rows on either side of you. A man at DOTS 400 is halfway between 380 and 420, which reads as the 75th percentile, halfway between 68 and 82. The DOTS calculator on this site takes the same linear step.
Body weight is already handled, because DOTS folds it into the score before you reach this page. That is why one table per sex is enough, and why there is no body weight column. The score itself is:
x    = body weight in kg, clamped to 40 to 210 (men) or 40 to 150 (women)
DOTS = total in kg × 500 / (A + B·x + C·x² + D·x³ + E·x⁴)
The five coefficients differ by sex, and they are printed on the DOTS calculator, which runs them for you.
Men: DOTS to percentile
Every row below is copied from the shipped file, with nothing rounded or smoothed.
| Percentile | DOTS |
|---|---|
| 1st | 180 |
| 5th | 220 |
| 15th | 260 |
| 30th | 300 |
| 50th | 340 |
| 68th | 380 |
| 82nd | 420 |
| 91st | 460 |
| 96th | 500 |
| 98.5th | 540 |
| 99.5th | 580 |
Two landmarks fall between rows, since DOTS 400 reads as the 75th percentile and DOTS 450 lands at 88.75, which the app shows as the 88th (it rounds down) and the web calculator as the 89th (it rounds to nearest). Either way, the top ten percent of competing men starts a little above 450.
Women: DOTS to percentile
| Percentile | DOTS |
|---|---|
| 1st | 160 |
| 5th | 200 |
| 15th | 240 |
| 30th | 280 |
| 50th | 320 |
| 68th | 360 |
| 82nd | 400 |
| 91st | 440 |
| 96th | 480 |
| 98.5th | 520 |
| 99.5th | 560 |
Each women’s row is 20 DOTS below the men’s row at the same percentile, and that gap belongs to this reference set rather than to the DOTS formula. A woman at DOTS 400 lands on the 82nd row, while a man at the same score reads as the 75th.
Where these numbers come from
The file is app/src/main/assets/benchmarks/dots_percentiles.json, and it holds 11 rows for men and 11 for women, so the tables above print all 22. The values were pulled out of the file by a short script on 2026-09-02 rather than typed by hand, so the page and the app cannot drift apart without someone changing the file.
The file’s own source line names the reference set, which is an OpenPowerlifting composite with four filters:
- Raw classic lifting. No squat suits and no bench shirts.
- Full meets. A squat, a bench, and a deadlift, added into one total. Bench-only meets are left out.
- Tested federations. Meets run under a drug testing rule.
- 2020 to 2024. Five seasons of results.
The score on each row is DOTS, from Tim Konertz’s 2019 formula, with the coefficients OpenPowerlifting publishes. The percentile on each row is the share of that filtered set scoring at or below the row’s DOTS, which is the definition written into the file.
One number is missing on purpose, because the file does not state how many lifters are in the set, and neither does the note that documents it. We will not print a count we cannot trace, so there is none here.
The DOTS calculator carries the same 22 rows in its script. A check script in the repo holds the calculator’s DOTS math to published worked examples and to the app’s own coefficients on every commit, and holds the two tables on this page to the app’s percentile file. The percentile rows are the app’s rows, so a DOTS from the calculator reads against the same tables the app uses.
What the tables do not tell you
The tables are honest about their crowd, and these are the four limits worth holding in mind.
Competing lifters only. Everyone in the set entered a meet and posted a total, which skews the set strong, since most people who train never compete. Against the whole gym, any DOTS ranks higher than the row says, so a DOTS 300 sits at the 30th percentile here and is still well above average among people who lift.
No age factor. A 60 year old and a 25 year old read off the same row. The International Powerlifting Federation (IPF) publishes age factors for masters and sub-junior lifters, and Kinoku does not apply them, so these tables do not either.
Tested, not untested. The set is tested federations only, and untested meets tend to post higher totals, so a score from an untested meet will rank a bit high against these rows. The bar here is the stricter one on purpose.
Meet totals, not gym personal records (PRs). A meet total is three lifts on one day, judged to depth and to a lockout, with commands, while a gym total is often the best of each lift from different days, with a soft depth call. The two are not the same number, so a gym total scored against this table reads as a rough guide.
Two smaller edges are worth naming. Below the first row Kinoku shows the 1st percentile, and above the last row it shows the 99th, while the file gives one curve per sex and has no non-binary row.
Track this in Kinoku
The Strength Standards feature reads your DOTS from your own logged lifts and prints a chip next to it that reads “top N%”, which is 100 minus the percentile on these tables. The tables on this page are the file it reads from, and no network call is made. It is part of Pro Analytics, and the lift history it draws on lives in your free stats.
Without the app, the DOTS calculator gives you the score and the percentile in your browser. The DOTS explainer covers the formula and the five band names. And if you are not sure whether DOTS is the score to watch, Wilks vs DOTS vs IPF GL settles that by where you lift.
References
Track this in the app
Strength Standards
DOTS, IPF GoodLift, Wilks 2, and FFMI with offline percentile tables. Published tools widely used in strength sport.
Core tracking works offline, with no mandatory account.
Related features
DOTS, IPF GoodLift, Wilks 2, and FFMI with offline percentile tables. Published tools widely used in strength sport.
A Pro hub with five core tabs, plus a Cycle tab when cycle tracking is on. Its 20+ features include strength scores like DOTS, IPF GL, Wilks, and FFMI, the Banister Form Band, plateau alerts, ACWR, muscle balance, and cycle links.
Charts per exercise, PRs, your best one-rep estimate, volume trends, and date filters. Every exercise type gets a chart that fits it: Best, Total, and Avg Time for holds, Best and Total Reps for rep work, and Best and Total Distance for distance work, not just weight charts.