

Which Training Number Should You Actually Watch?
Why two honest apps score the same run differently, which metric answers which question, and what to do when your watch and your training log disagree.
Kinoku in practice
Where this shows up in the app
 Open full-size image ↗
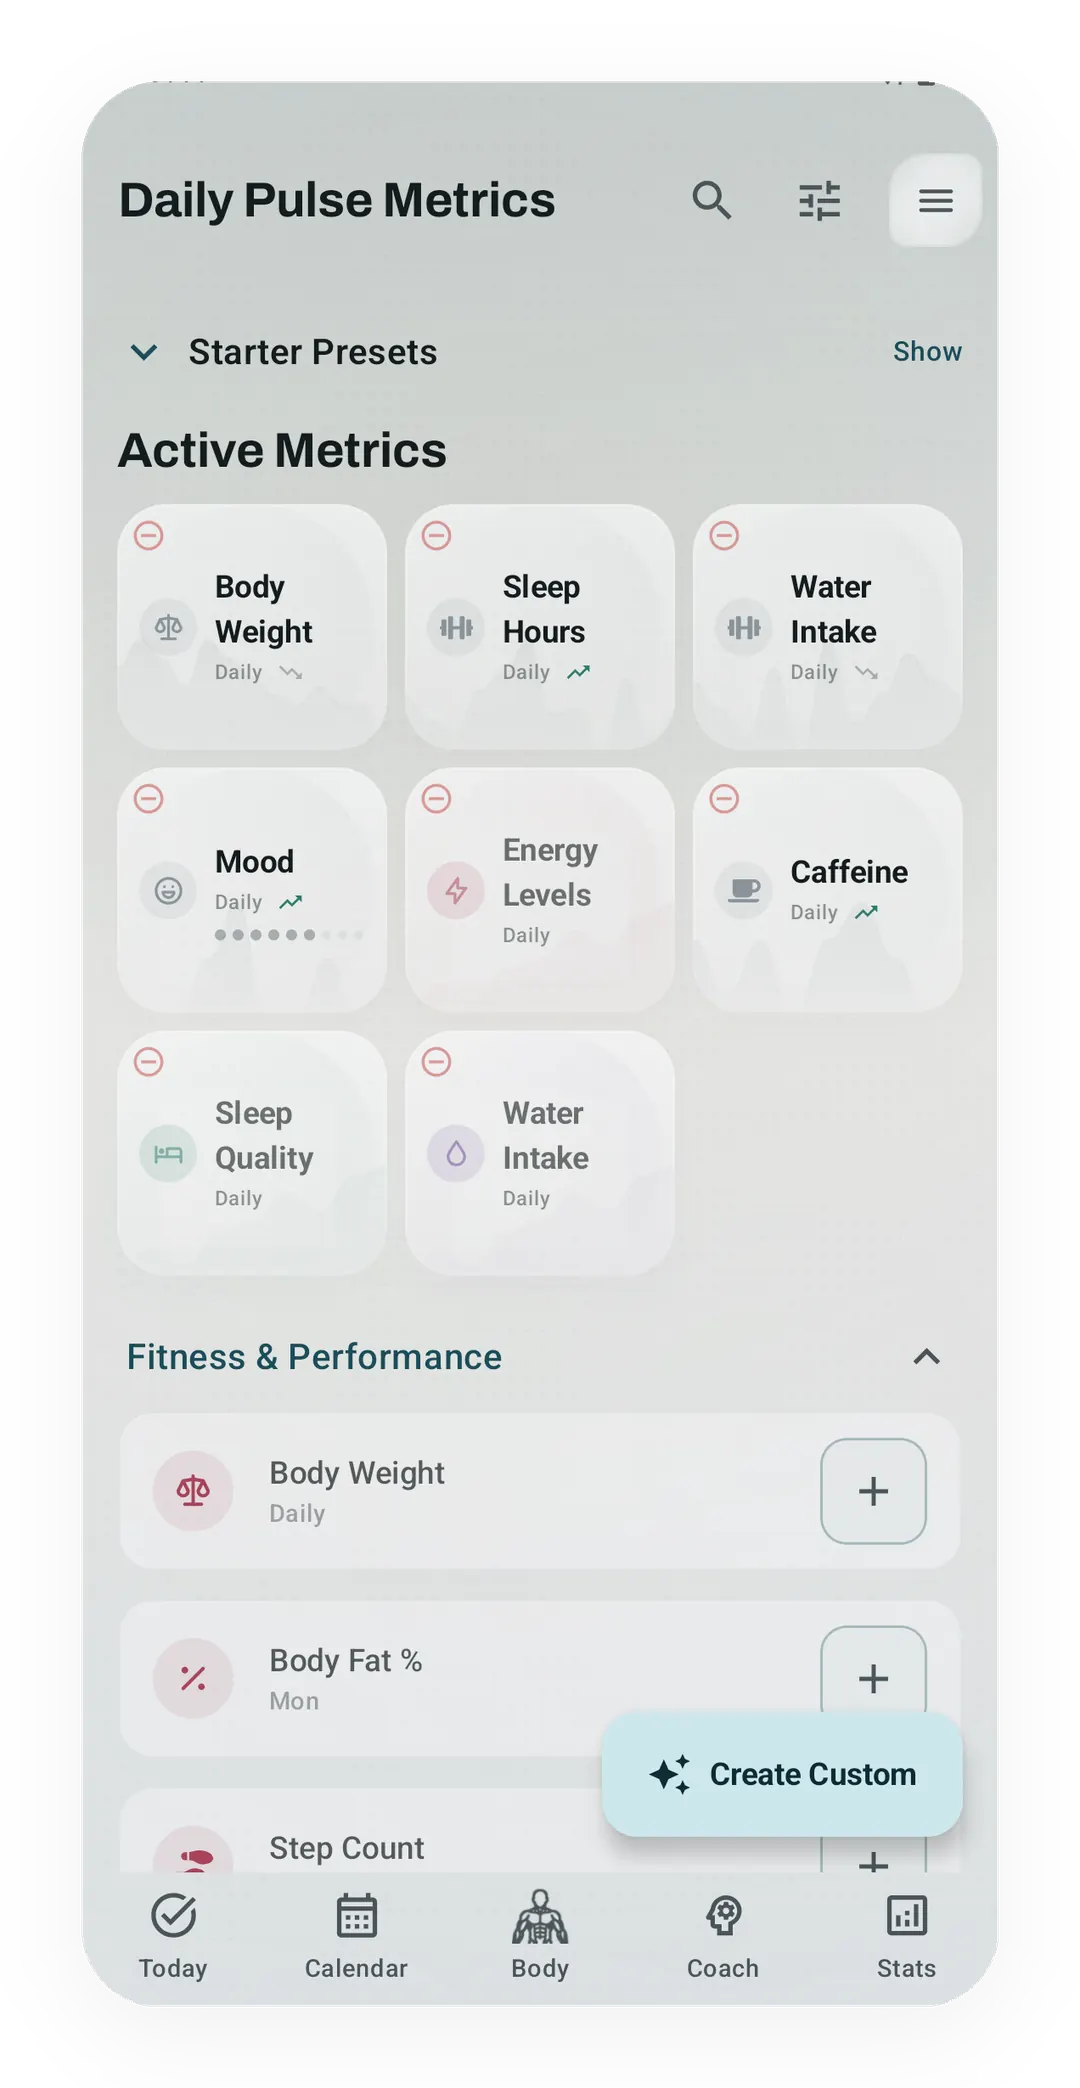
Metrics with readable cards
Kinoku presents daily signals as named cards with units and trends rather than an unexplained stream of numbers.
Quickstart
Every training number answers one of four questions, and numbers from different questions do not compare, even when they sound alike. One group rates a single session: TRIMP (a heart-rate training load), TSS (a pace-versus-threshold stress score), and Training Effect. Another tracks a whole block, with a slow load average called fitness (CTL), a fast one called fatigue (ATL), their gap called form (TSB), and recent load against a baseline, the acute-to-chronic workload ratio (ACWR). A third rates strength for your size: DOTS (the common cross-federation score), IPF GL (the International Powerlifting Federation’s GoodLift score), Wilks, and Sinclair. The last rates how a set felt, in rate of perceived exertion (RPE) and reps in reserve (RIR).
| The question | The numbers |
|---|---|
| How hard was that one session? | TRIMP, TSS, Training Effect |
| How is the block going? | CTL, ATL, TSB, ACWR, Readiness |
| How strong is that for my size? | DOTS, IPF GL, Wilks, Sinclair |
| How hard did that set feel? | RPE, RIR |
The metric decoder lays all of them out side by side, with the ones Kinoku computes marked.
Why two honest apps disagree about the same run
You ran an easy hour, and one app says that was a hard day while the other says it was nothing. Neither app is broken.
They are measuring different things. TRIMP watches your heart, while TSS watches your pace against your threshold. On a hot day, or the morning after a bad night, your heart rate runs high at the same pace, so TRIMP goes up while TSS does not move. Both are telling the truth about what they measure.
They are scaled to you, differently. TSS needs a threshold pace that you set yourself, so set it slow and every run scores high. Two apps with different thresholds will print different numbers off the same GPS file, and both will be right about their own scale.
One of them has a ceiling. Training Effect stops at 5, while TSS does not stop at all. A three-hour easy ride can be a big TSS and a middling Training Effect on the same afternoon, because one is adding up work and the other is rating a session.
The useful habit: pick one number per question and watch it against your own history. A score is a ruler, and rulers only compare when they are the same ruler.
Heart rate or pace
Two of the session scores need a chest strap or a decent wrist sensor, and one does not.
Heart rate is honest about strain and slow to react. It rises in heat, when you are under-slept, when you are dehydrated, and when you are getting ill. That is a feature when you want to know what the day cost you, and noise when you want to know what you did.
Pace and power are honest about work and blind to context. Same splits, same score, whether you floated it or crawled home.
Effort needs no hardware at all. Foster’s session method is one rating for the whole session times its length. Published in 2001, it has held up, and it tracks the hardware-based numbers well enough that a strap is a convenience rather than a requirement.
Kinoku saves both TRIMP figures and TSS on any GPS run that recorded heart rate, and the order it picks them in for load is on the TRIMP vs TSS page. It logs RPE per set rather than computing a session load number, so the Foster figure is not one you will find in the app.
Training Effect is on somebody else’s scale
Training Effect runs 0 to 5, a scale Firstbeat set that now sits on a lot of watches.
Kinoku shows a number on that scale. The weights behind it are ours, not Firstbeat’s. Firstbeat’s algorithm is not published, so nobody outside Garmin can reproduce it. Ours reads time in each heart-rate zone, weights higher zones more, and flattens off so a long easy session does not keep climbing.
Our 3.2 and a Garmin 3.2 are near neighbours, not the same measurement, and the decoder marks that row as ours on a shared scale for exactly this reason.
The same caution applies to anything with a closed formula. Body Battery is Garmin’s and is not in Kinoku, because a number we cannot reproduce is a number we cannot explain to you.
Fitness, fatigue and form are one model, not three
CTL, ATL and TSB look like three metrics, but they are one.
Feed a daily load number into two rolling averages, a slow one around six weeks and a fast one around one week. The slow one gets called fitness and the fast one fatigue, and subtracting them gives the difference called form.
Two things follow, and both trip people up.
They cannot disagree with each other. If your form is deeply negative, it is because fatigue is above fitness, and there is no second opinion in there.
Negative form is the normal state of training. Around minus 10 to minus 25 is where fitness gets built, while zero mostly means you have not done much lately. A form curve sitting at zero is not a clean bill of health.
ACWR is a ramp check, not a verdict
The acute-to-chronic ratio compares recent load with a longer baseline. A value well above 1 means load rose quickly. That is the useful claim; it is not an injury forecast.
The metric is contested: Gabbett’s 2016 paper put it on the map, while a 2021 paper argued the theory should be retired. Kinoku therefore presents ratios as context, not instruction. The Pro Analytics Recovery gauge uses lift tonnage over 7 and 28 days. Kinoku Score uses a separate 7-day-versus-42-day exponentially weighted ratio on a unified TSS-equivalent stream that can include lifting, running, brisk walking, and time-based sessions. The ratio and the Form curve answer different questions, and ACWR vs the fitness-fatigue model covers which one warns first.
RPE and RIR are the same scale
RPE rates how hard a set felt, on a 1-to-10 scale, and RIR counts the reps you had left, so the two map onto each other:
| RPE | Reps in reserve |
|---|---|
| 10 | 0 |
| 9 | 1 |
| 8 | 2 |
| 7 | 3 |
| 6 | 4 |
Zourdos and colleagues published the lifting version in 2016, anchored to reps in reserve rather than to breathlessness. If someone says “RPE 8” and someone else says “2 RIR”, they said the same thing. Which one to log for autoregulation is settled on the RPE vs RIR page.
Strength scores are all doing one job
DOTS, IPF GL and Wilks all turn a powerlifting total into one number that compares across body weights, and they differ in the curve they use and who wrote it, not in what they are for.
- Wilks came first, in 1994, and was reworked in 2020. Many groups still keep it on record.
- DOTS was written in 2019 for the German federation and is now the common cross-federation score.
- IPF GoodLift is the IPF’s own, from 2020, with separate numbers for raw and equipped lifting.
- Sinclair does the same job for Olympic weightlifting. Kinoku does not compute it, so there is no Kinoku calculator for it.
FFMI (fat-free mass index) often gets grouped with these, and it is not one of them. It is about how much lean mass you carry for your height, not what you can lift.
Which of the three to watch depends on where you lift. The Wilks vs DOTS vs IPF GL page makes that call. The one-rep estimate on a single lift is a different job again, and the Epley vs Brzycki page says which formula to trust.
What to do when your numbers disagree
- Check they answer the same question. A session score and a block score will never line up, and neither is wrong.
- Check the scale is yours. A threshold set months ago drifts. So does a max heart rate you never measured.
- Prefer the signal to the composite. When a recovery score and your own read disagree, look at what went into the score. Sleep and resting heart rate are measurements. The single number on top is a weighting somebody chose.
- Compare to your own history. Every one of these is a good ruler and a bad yardstick.
Track this in Kinoku
The free training form card draws fitness, fatigue, and form from the unified load stream. Run analytics can supply power-based TSS, heart-rate TRIMP, or a pace-zone estimate; swims, classes, rowing, and mobility use session RPE and duration when available.
Where a Kinoku number sits on somebody else’s scale, the decoder says so on the row.
References
Track this in the app
Form Band
A fitness-and-fatigue curve built from the same published family of impulse-response models made popular by TrainingPeaks, and it works across gym, run, and brisk-step load.
Core tracking works offline, with no mandatory account.
Related features
A fitness-and-fatigue curve built from the same published family of impulse-response models made popular by TrainingPeaks, and it works across gym, run, and brisk-step load.
Offline run breakdown with splits, a fitness score from your runs, a pacing score, best efforts, race forecasts, and a compare card that stacks each run against your similar past runs.
A Pro hub with five core tabs, plus a Cycle tab when cycle tracking is on. Its 20+ features include strength scores like DOTS, IPF GL, Wilks, and FFMI, the Banister Form Band, plateau alerts, ACWR, muscle balance, and cycle links.